Mastering Datadog's Dashboard: A Comprehensive Guide

Datadog is a powerhouse in monitoring and analytics, offering real-time insights into your applications, infrastructure, and services. Understanding how to effectively use Datadog's dashboard is crucial for getting the most out of this powerful tool. In this comprehensive guide, we'll delve into various aspects of Datadog's dashboard, including the setup, customization options, integration with APIs, and how to leverage OpenAPI.
The Importance of a Well-Configured Dashboard
When it comes to managing APIs, especially in complex microservices architectures, the role of a well-configured dashboard cannot be overstated. Datadog's dashboard enables teams to visualize performance metrics, monitor API call patterns, and identify bottlenecks in real time. This visual representation of data allows for proactive troubleshooting and performance optimization.
To set up a Datadog dashboard that meets your needs, understanding API usage and metrics is key. This can include tracking endpoints, response times, error rates, and overall API performance. Moreover, utilizing a robust API management platform like APIPark can significantly enhance your API monitoring capabilities by providing a streamlined integration process and detailed analytics.
Getting Started with Datadog
Step 1: Create a Datadog Account
To begin, you'll need a Datadog account. Navigate to the Datadog website and sign up for a free trial. Once you’ve created your account, follow the setup instructions to properly configure your workspace.
Step 2: Install the Datadog Agent
The next step is to install the Datadog Agent that will collect data from your applications and infrastructure. You can do this easily by following the platform-specific installation instructions provided in Datadog's documentation.
# For example, on Ubuntu:
DD_AGENT_MAJOR_VERSION=7 DD_API_KEY=<YOUR_API_KEY> bash -c "$(curl -L https://s3.amazonaws.com/ddAgent/scripts/install_script.sh)"
Step 3: Integrate APIs
To effectively monitor your APIs, you should integrate them within Datadog. This can be done by sending metrics from your application or using a dedicated API integration. Once your applications are sending data to Datadog, you'll begin to see real-time updates appearing on your dashboard.
Integrating APIs is vital because it allows you to track performance and health directly from your API layer. With the robust capabilities of OpenAPI specifications, you can define your APIs clearly and ensure that Datadog captures the metrics you need.
Customizing Your Dashboard
One of the significant features of Datadog is its customizable dashboards. This flexibility allows users to design their dashboards to focus on the most critical metrics and KPIs. Here’s how to create and customize your dashboard:
Step 1: Create a New Dashboard
Navigate to the dashboard section on the Datadog interface and select "New Dashboard". You can choose from various visualizations such as graphs, heat maps, and tables.
Step 2: Add Widgets
Widgets are the building blocks of your dashboard. You can add a widget by selecting "Add Widget", which prompts you to choose a visualization type. Depending on your needs, you can visualize metrics in line charts, bar graphs, or even tables that display your API call statistics.
Example Table of API Metrics
Below is an example of how you might structure a table of API metrics that you want to monitor:
| API Endpoint | Total Calls | Average Response Time | Error Rate | 90th Percentile Response Time |
|---|---|---|---|---|
/api/v1/users |
15,000 | 200 ms | 2% | 350 ms |
/api/v1/orders |
10,000 | 150 ms | 1% | 250 ms |
/api/v1/products |
25,000 | 300 ms | 3% | 450 ms |
This table can help teams quickly assess which APIs are performing well and which ones might need attention based on their metrics.
Step 3: Customize Widget Settings
Once you have added the required widgets, customize their settings to define time ranges, display options, and thresholds for alerts. Setting thresholds is crucial for maintaining the health of your APIs. You might want to receive alerts if the error rate exceeds a specific threshold or if response times become unacceptably high.
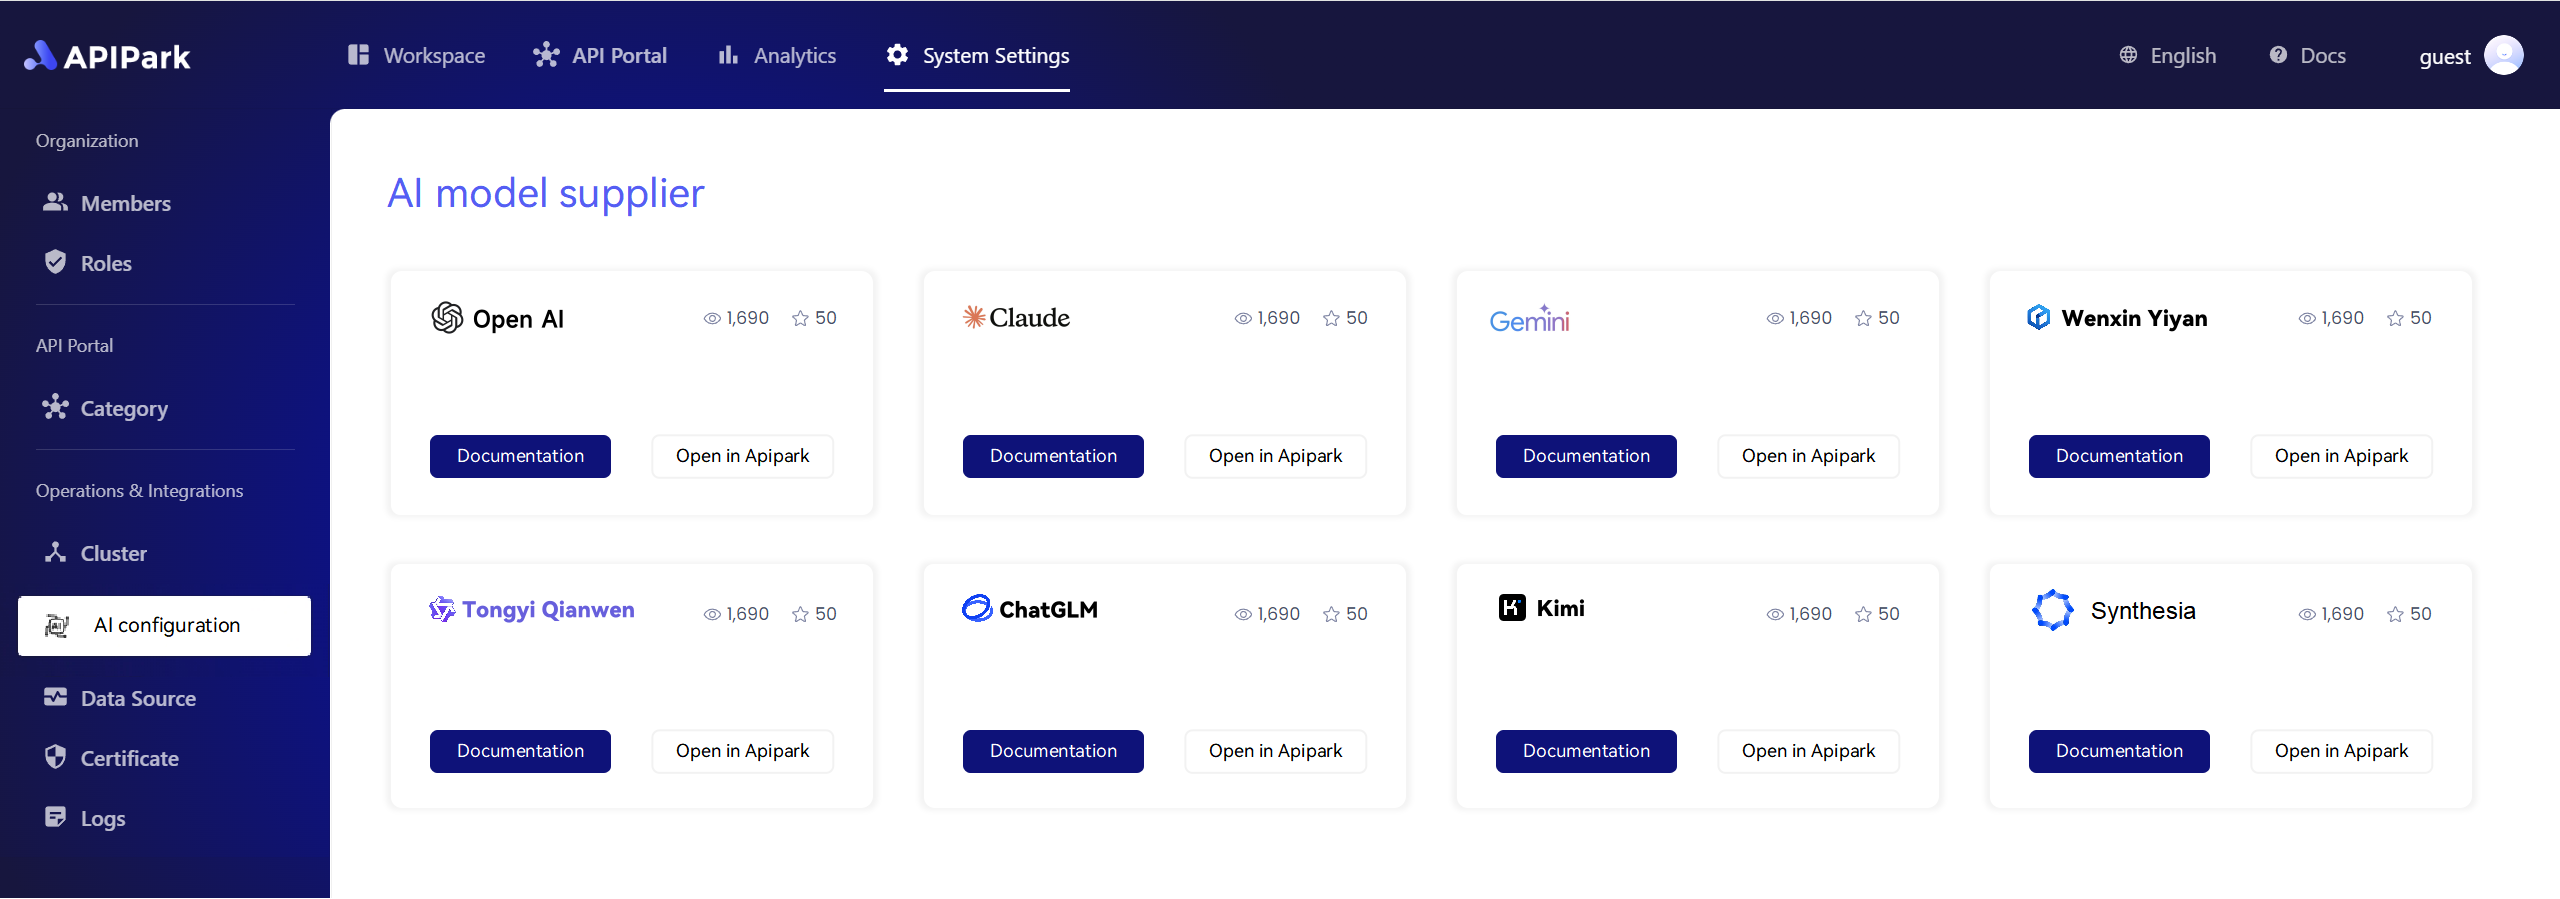
APIPark is a high-performance AI gateway that allows you to securely access the most comprehensive LLM APIs globally on the APIPark platform, including OpenAI, Anthropic, Mistral, Llama2, Google Gemini, and more.Try APIPark now! 👇👇👇
Tracking API Performance with Datadog
Effective API monitoring involves not only viewing metrics but analyzing trends over time. Datadog's dashboard provides this functionality, allowing you to view historical data and make informed decisions about your API management.
You can use Datadog’s analytics to track changes for specific endpoints and identify patterns or anomalies. For example, if you notice a significant increase in response times for a particular endpoint, you can take proactive steps to address potential issues.
Using OpenAPI for API Documentation
Incorporating OpenAPI specifications allows you to document your APIs thoroughly. This documentation can then be used in conjunction with Datadog to create a cohesive monitoring experience. When APIs are well-documented, your teams can understand expected performance metrics and system behavior, which improves response times and debugging processes.
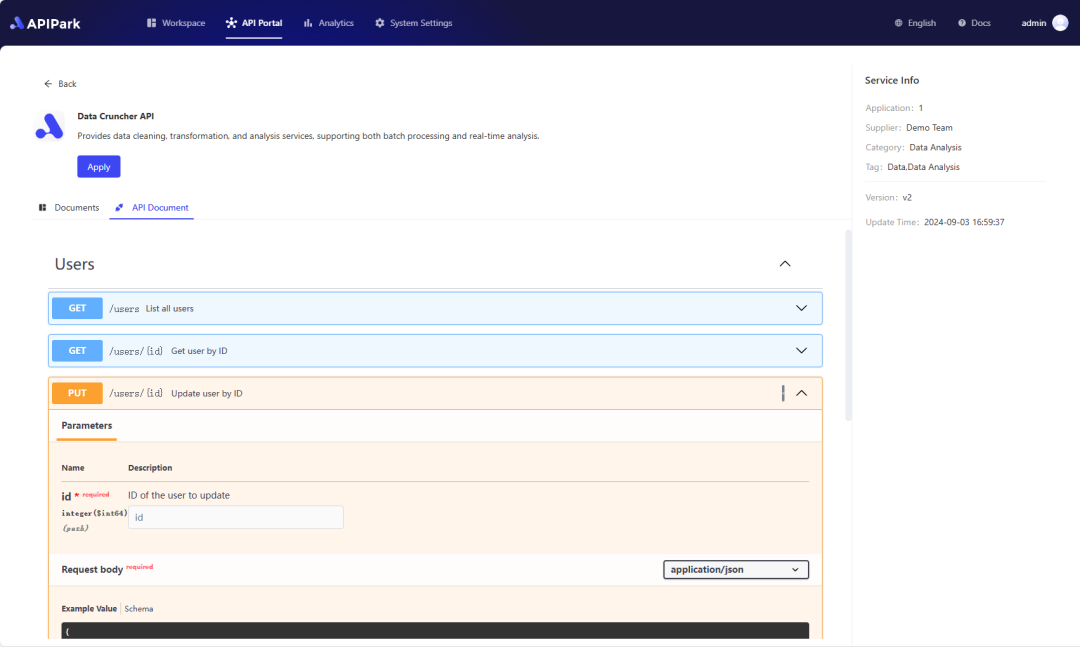
Using tools like APIPark can streamline this process, as it supports OpenAPI specifications seamlessly, enabling developers to maintain high standards in API management and documentation.
Advanced Dashboard Features
Datadog provides several advanced features that enhance the monitoring experience. Here are a few noteworthy capabilities:
1. Anomaly Detection
Datadog has built-in Machine Learning models that can detect anomalies in your API performance metrics. This feature allows teams to quickly identify issues before they affect users.
2. Monitor Traces
Integrating Datadog with your tracing tools can give you end-to-end visibility into your API requests. This means you can track the path of requests through your microservices architecture and identify bottlenecks.
3. Log Management
Datadog’s log management features allow you to ingest logs from your APIs, creating a rich dataset for further analysis. This can be particularly useful for debugging and understanding failure modes.
Conclusion
Mastering Datadog's dashboard is essential for any team that wants to optimize their API performance and enhance the overall user experience. By integrating your APIs, customizing your dashboard, and harnessing the power of features like anomaly detection and tracing, you set the foundation for successful API monitoring.
Utilizing tools like APIPark can elevate your API management to the next level by ensuring that you have a clear understanding of your API landscape, integrating easily with Datadog, and providing comprehensive monitoring capabilities.
FAQ
- What is Datadog?
- Datadog is a monitoring and analytics platform that provides real-time insights into applications, infrastructure, and services.
- How do I create a dashboard in Datadog?
- To create a dashboard, navigate to the dashboard section in Datadog, click "New Dashboard," and add the desired widgets to visualize your desired metrics.
- Can Datadog monitor API performance?
- Yes, Datadog is well-suited for monitoring API performance by tracking metrics such as response times, error rates, and total calls.
- What is OpenAPI?
- OpenAPI is a specification for documenting REST APIs, allowing for clear and standardized descriptions of APIs that facilitate better collaboration and integration.
- How does APIPark integrate with Datadog?
- APIPark can streamline the integration process, offering unified API management which enhances the monitoring capabilities of Datadog through standardized data formats and detailed analytics.
🚀You can securely and efficiently call the OpenAI API on APIPark in just two steps:
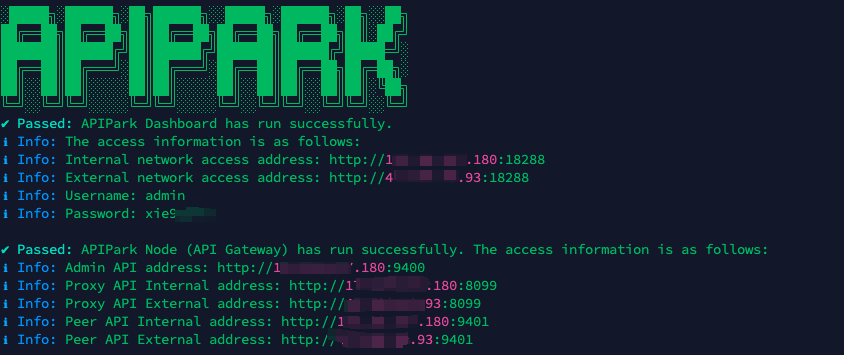
Step 1: Deploy the APIPark AI gateway in 5 minutes.
APIPark is developed based on Golang, offering strong product performance and low development and maintenance costs. You can deploy APIPark with a single command line.
curl -sSO https://download.apipark.com/install/quick-start.sh; bash quick-start.sh

In my experience, you can see the successful deployment interface within 5 to 10 minutes. Then, you can log in to APIPark using your account.

Step 2: Call the OpenAI API.

Learn more
Getting Started with Dashboards - Datadog Infrastructure and ...
Dashboards - Datadog Infrastructure and Application Monitoring

