Master Your Data with Datadogs Dashboard: Ultimate Guide to Efficiency
Introduction
In the modern digital landscape, the management and analysis of data have become critical components of any successful business strategy. Datadog, a leading monitoring and analytics platform, offers a comprehensive solution to this challenge with its intuitive and powerful dashboard. This guide will delve into the various aspects of the Datadog dashboard, exploring its features, benefits, and how it can help you master your data with efficiency.
Understanding the Datadog Dashboard
Overview of Datadog Dashboard
The Datadog dashboard is a centralized hub that provides real-time insights into your data, allowing you to monitor, analyze, and optimize your systems and applications. It integrates data from various sources, including servers, databases, applications, and services, to offer a comprehensive view of your infrastructure.
Key Features of Datadog Dashboard
- Real-time Monitoring: Datadog provides real-time monitoring, ensuring that you are always aware of the performance and health of your systems.
- Customizable Dashboards: You can create custom dashboards tailored to your specific needs, displaying the metrics and metrics that matter most to you.
- Alerting and Notifications: Set up alerts to notify you of any issues or anomalies in your systems, allowing you to address them promptly.
- Integration with Third-party Services: Datadog integrates with a wide range of third-party services, including AWS, Azure, Google Cloud, and more.
- Automated Visualization: Datadog automatically generates visualizations based on your data, making it easier to understand and interpret.
- Adaptive Sampling: This feature allows you to efficiently process and analyze large volumes of data without impacting performance.
Navigating the Datadog Dashboard
Setting Up Your Dashboard
- Accessing the Dashboard: Log in to your Datadog account and navigate to the dashboard section.
- Creating a New Dashboard: Click on the “Create Dashboard” button and choose from various templates or start from scratch.
- Adding Visualizations: Add visualizations by selecting the data source and metrics you want to display.
- Customizing the Dashboard: Customize the layout, colors, and other settings to suit your preferences.
Understanding the Visualization Types
- Graphs and Charts: These visualizations are great for displaying trends and patterns over time.
- Maps: Use maps to visualize geographical data, such as server locations or user locations.
- Tables: Tables are useful for displaying detailed data, such as logs or metrics.
- Heatmaps: Heatmaps provide a visual representation of data density, allowing you to identify hotspots or areas of concern.
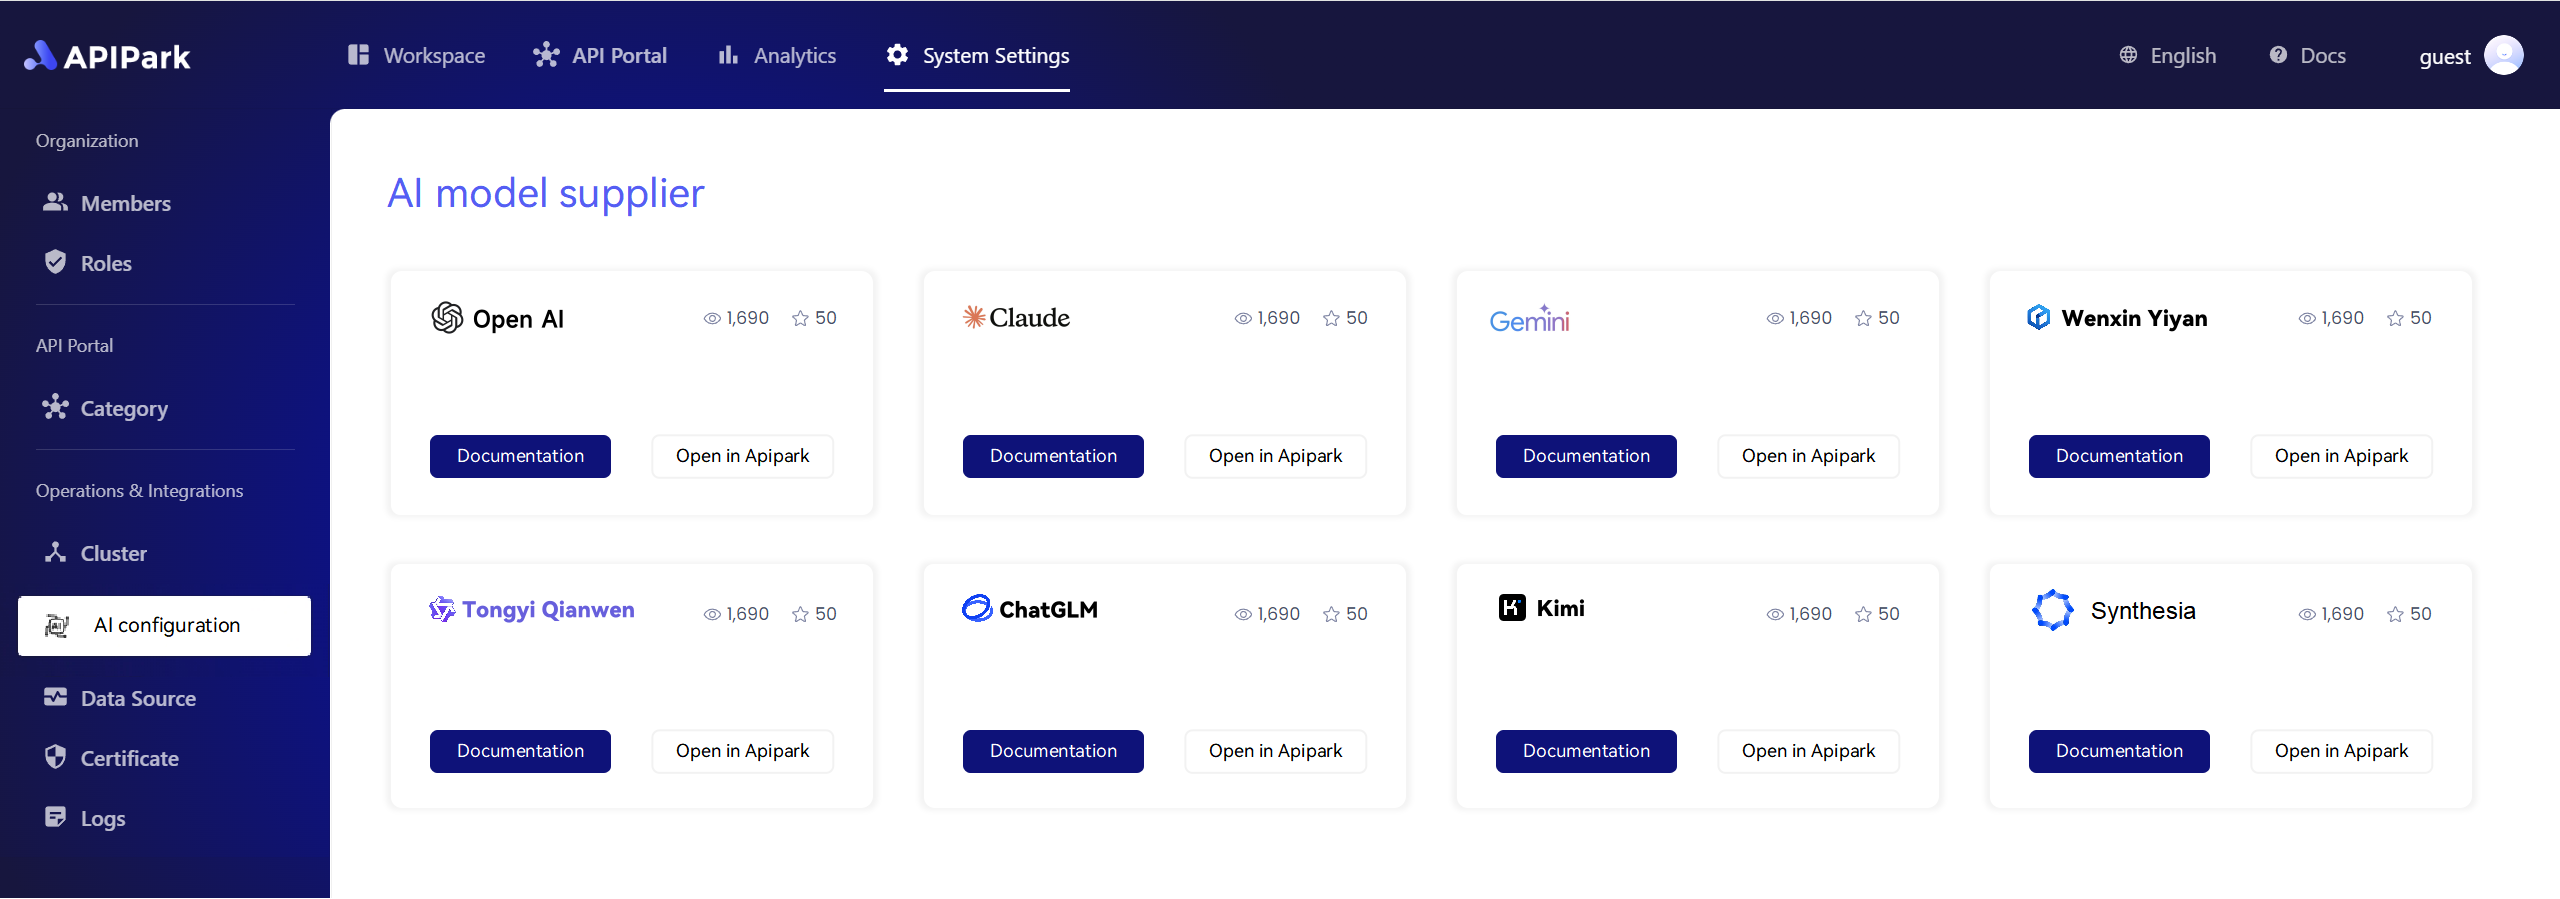
APIPark is a high-performance AI gateway that allows you to securely access the most comprehensive LLM APIs globally on the APIPark platform, including OpenAI, Anthropic, Mistral, Llama2, Google Gemini, and more.Try APIPark now! 👇👇👇
Leveraging Datadog for Data Analysis
Data Collection
Datadog collects data from various sources, including your applications, servers, and services. You can configure data collection by setting up agents or using APIs.
Data Analysis
- Querying Data: Use Datadog's query language to search and analyze your data.
- Dashboards for Analysis: Create dashboards that provide insights into specific aspects of your data.
- Custom Metrics: Define custom metrics to track specific aspects of your applications or infrastructure.
Integrating Datadog with APIPark
Overview
APIPark, an open-source AI gateway and API management platform, can be integrated with Datadog to enhance your data management and analysis capabilities.
Integration Steps
- Set Up APIPark: Install and configure APIPark in your environment.
- Configure Datadog Integration: Integrate Datadog with APIPark by setting up the necessary configurations.
- Collect Data: Use APIPark to collect and manage your API data, which can then be sent to Datadog for analysis.
- Create Dashboards: Create dashboards in Datadog to visualize and analyze your API data.
Conclusion
Mastering your data with efficiency is crucial for any business looking to thrive in the digital age. Datadog's dashboard, with its powerful features and seamless integration capabilities, provides a comprehensive solution for data management and analysis. By integrating Datadog with APIPark, you can further enhance your data management capabilities and gain deeper insights into your systems and applications.
FAQs
- What is the Datadog dashboard? The Datadog dashboard is a centralized hub that provides real-time insights into your data, allowing you to monitor, analyze, and optimize your systems and applications.
- How do I set up a custom dashboard in Datadog? To set up a custom dashboard, navigate to the dashboard section in your Datadog account, click on “Create Dashboard,” and choose from various templates or start from scratch.
- Can I integrate Datadog with APIPark? Yes, you can integrate Datadog with APIPark to enhance your data management and analysis capabilities.
- What are the benefits of using Datadog for data analysis? Datadog provides real-time monitoring, customizable dashboards, integration with third-party services, and automated visualization, making it easier to understand and interpret your data.
- How can I improve the efficiency of my data management? By using tools like Datadog and APIPark, you can streamline your data collection, analysis, and visualization processes, leading to more efficient data management.
🚀You can securely and efficiently call the OpenAI API on APIPark in just two steps:
Step 1: Deploy the APIPark AI gateway in 5 minutes.
APIPark is developed based on Golang, offering strong product performance and low development and maintenance costs. You can deploy APIPark with a single command line.
curl -sSO https://download.apipark.com/install/quick-start.sh; bash quick-start.sh
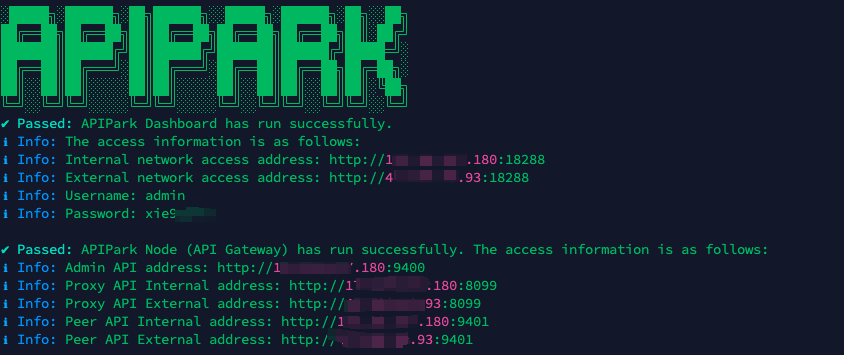
In my experience, you can see the successful deployment interface within 5 to 10 minutes. Then, you can log in to APIPark using your account.
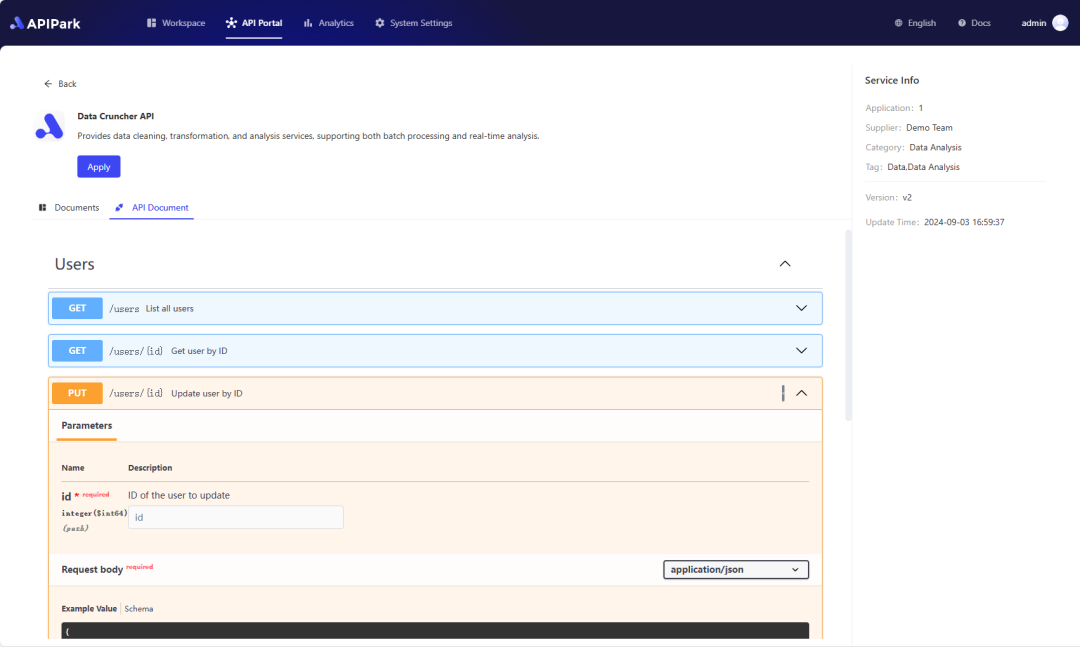
Step 2: Call the OpenAI API.
