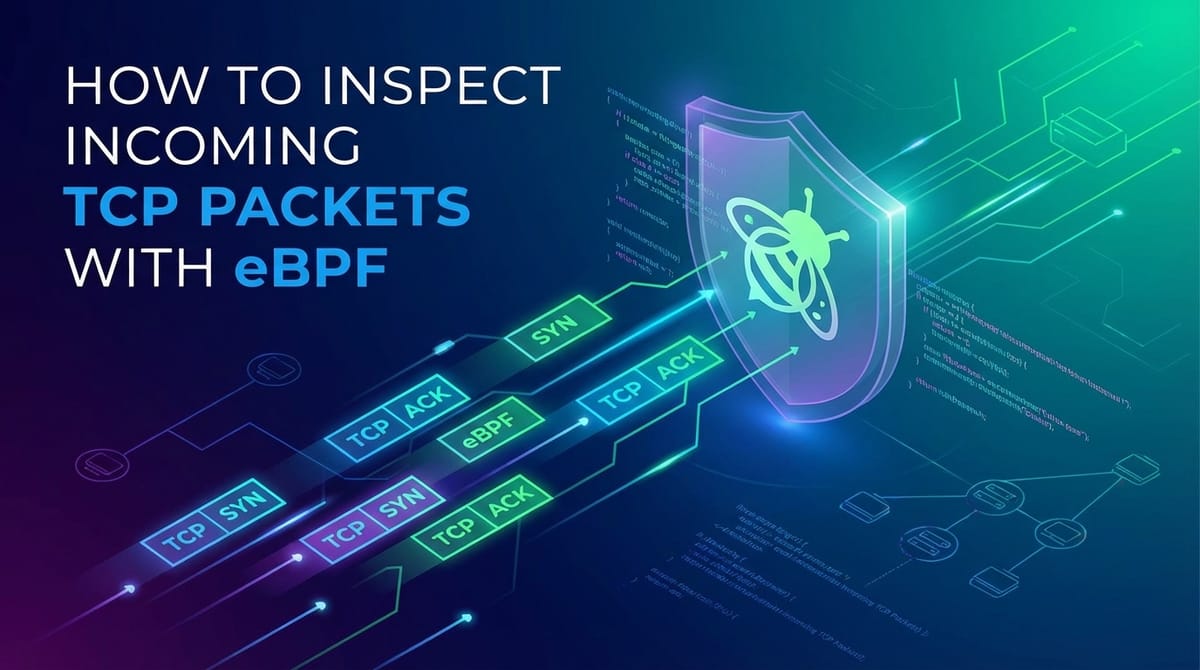
How to Inspect Incoming TCP Packets with eBPF


In the intricate dance of modern computing, where applications communicate across vast networks and microservices orchestrate complex operations, the humble TCP packet remains a fundamental building block. Understanding the journey and contents of these packets as they arrive at a system is not merely an academic exercise; it is an indispensable capability for diagnosing performance bottlenecks, identifying security threats, and ensuring the robust operation of distributed systems. However, gaining deep, granular insight into incoming TCP traffic without disrupting the very systems we aim to monitor has traditionally been a formidable challenge. Legacy tools often introduce significant overhead, lack the necessary flexibility, or require invasive kernel modifications.
Enter eBPF (extended Berkeley Packet Filter), a revolutionary technology that has fundamentally transformed the landscape of kernel-level observability and programmability. eBPF empowers developers and system administrators to run custom, sandboxed programs directly within the Linux kernel, responding to a myriad of events, including those related to network packet reception. This capability unlocks an unprecedented level of visibility into the kernel's inner workings, offering a non-intrusive, efficient, and highly flexible mechanism for inspecting incoming TCP packets. From understanding the nuances of the TCP handshake to meticulously examining payload data, eBPF provides the scalpel needed for precise network diagnostics, security monitoring, and performance analysis. This comprehensive guide will delve deep into the world of eBPF, exploring its architecture, practical applications, and the methodologies required to effectively inspect incoming TCP packets, empowering you to gain unparalleled control and insight over your network traffic.
The Landscape of Network Observability: Traditional Methods vs. eBPF's Revolution
The pursuit of understanding network behavior is as old as networking itself. For decades, system administrators and network engineers have relied on a suite of tools and techniques to peer into the network stack. These traditional methods, while foundational, often present significant trade-offs in terms of granularity, performance impact, and flexibility, particularly when dealing with the demands of modern, high-throughput, and dynamic environments.
One of the most common and accessible approaches involves user-space packet sniffers like tcpdump or Wireshark. These tools operate by placing the network interface into promiscuous mode and capturing packets that traverse it. While invaluable for debugging and general network analysis, their limitations become apparent at scale. First, they operate in user space, meaning every captured packet must traverse the kernel-user space boundary, incurring context switching overhead. For high-volume traffic, this can lead to dropped packets, an incomplete picture, or even a noticeable performance degradation on the host system. Second, these tools typically capture entire packets, which can be excessive when only specific header fields or events are of interest. Filtering capabilities exist, but they are often applied after the kernel has already passed the packet to user space, thus not reducing the fundamental overhead of data transfer. Furthermore, tcpdump provides a snapshot of what is happening on the wire, but struggles to provide context on why it's happening within the kernel's decision-making process, such as why a packet was dropped or how a specific socket is behaving.
Another set of tools involves kernel modules or specialized device drivers. These can offer deeper insights by integrating directly into the kernel's network stack. However, developing and deploying kernel modules is a complex and often perilous undertaking. They require deep kernel programming expertise, are notoriously difficult to debug, and can easily introduce system instability or security vulnerabilities if not meticulously crafted and tested. Every kernel version often necessitates recompilation or modification, leading to significant maintenance burdens in environments with rolling updates or diverse kernel versions. The static nature of these modules also means that changing monitoring logic requires recompiling and reloading the module, potentially causing system downtime. This rigidity makes them ill-suited for the rapid iteration and dynamic observability needs of cloud-native architectures.
More specialized approaches include various netfilter hooks for firewalling and packet manipulation, ip_tables for rule-based filtering, and procfs/sysfs for exposing limited kernel statistics. While useful for their specific purposes, they lack the programmability and event-driven nature required for sophisticated, custom packet inspection. They are declarative in nature, specifying what to do, rather than offering the ability to execute custom logic at arbitrary points in the network stack.
The advent of eBPF represents a fundamental paradigm shift. Instead of requiring full kernel modules or relying on user-space copies, eBPF programs are loaded into the kernel and execute in a highly efficient, sandboxed virtual machine. This means they run inside the kernel, at event points of interest, minimizing context switches and data copying. eBPF programs are also verified for safety before execution, preventing them from crashing the kernel or accessing unauthorized memory. This unique combination of kernel-level access, programmability, safety, and efficiency makes eBPF an unparalleled tool for deep network observability, surpassing the capabilities and overcoming the limitations of traditional methods. It empowers engineers to dynamically instrument the kernel, observe specific network events, and extract precisely the data required, all without the risks and overheads associated with older techniques.
Understanding TCP/IP Fundamentals: The Foundation for Packet Inspection
Before we can effectively inspect incoming TCP packets using eBPF, it's crucial to have a solid grasp of the underlying TCP/IP fundamentals. The Transmission Control Protocol (TCP) is a cornerstone of internet communication, providing reliable, ordered, and error-checked delivery of a stream of bytes between applications running on hosts. Its complexity, however, stems from the very mechanisms it employs to achieve this reliability.
At its core, TCP operates at Layer 4 (the Transport Layer) of the OSI model, building upon the Internet Protocol (IP) at Layer 3 (the Network Layer). IP is responsible for addressing and routing packets between hosts, but it offers an unreliable, connectionless service. TCP layers reliability on top of IP through several key mechanisms:
- Connection Establishment (Three-way Handshake): Before data can be exchanged, TCP establishes a logical connection. This involves a three-step process:
- SYN: The client sends a SYN (synchronize) segment to the server, indicating its desire to establish a connection and its initial sequence number.
- SYN-ACK: The server responds with a SYN-ACK segment, acknowledging the client's SYN, indicating its own initial sequence number, and accepting the connection.
- ACK: The client sends an ACK (acknowledgment) segment, confirming receipt of the server's SYN-ACK, thereby completing the handshake. This handshake is critical to understand, as eBPF can observe each stage, providing insights into connection attempts and potential failures.
- Data Transfer and Segmentation: Once a connection is established, application data is broken down into smaller chunks, known as segments. Each TCP segment is encapsulated within an IP packet. Key fields within the TCP header enable reliable delivery:
- Sequence Numbers: Each byte of data transmitted is assigned a sequence number. Segments carry the sequence number of their first byte.
- Acknowledgment Numbers: The receiver sends ACK segments back to the sender, indicating the sequence number of the next byte it expects to receive. This mechanism confirms successful delivery and drives retransmission if segments are lost.
- Window Size: This field indicates how much data the receiver is willing to accept, controlling flow and preventing a fast sender from overwhelming a slow receiver.
- Flags: A set of flags (e.g., SYN, ACK, FIN, RST, PSH, URG) convey control information about the segment's purpose. For incoming packets,
ACKis almost always set once the connection is established.PSHindicates the sender wants to push data to the application layer immediately.
- Connection Termination (Four-way Handshake): TCP connections are typically terminated gracefully through a four-way handshake, though an abrupt
RST(reset) can also occur.- FIN: When an application is done sending data, it sends a FIN (finish) segment.
- ACK: The peer acknowledges the FIN.
- FIN: The peer then sends its own FIN segment when it's also done.
- ACK: The initiator acknowledges the peer's FIN. Observing these flags is crucial for understanding the lifecycle of a connection.
- Error Control and Retransmission: If an ACK is not received within a certain timeout, TCP assumes the segment was lost and retransmits it. Duplicate ACKs also trigger retransmissions, signaling early loss detection. eBPF can be used to count retransmissions or identify specific conditions leading to them.
- Congestion Control: TCP employs sophisticated algorithms (e.g., slow start, congestion avoidance, fast retransmit, fast recovery) to adapt to varying network conditions and prevent network congestion collapse. These mechanisms adjust the sending rate based on observed acknowledgments and packet losses. While deeply integrated, observing metrics like round-trip time (RTT) and packet loss via eBPF can provide hints about congestion.
When an IP packet carrying a TCP segment arrives at a host, the network interface card (NIC) first processes it. The kernel's network stack then performs several crucial steps: * Layer 2 (Data Link): MAC address checks. * Layer 3 (Network): IP header validation, routing decisions (is it for me?), and potentially fragmentation/reassembly. * Layer 4 (Transport): TCP header validation, checksum verification, sequence number processing, window management, and ultimately delivering the data to the correct socket associated with an application process.
eBPF's power lies in its ability to hook into various points throughout this entire process, from the very early stages of packet reception (e.g., XDP programs) to the deeper processing within the TCP stack (e.g., kprobes on TCP functions). By understanding these fundamental TCP mechanisms and the packet's journey through the kernel, we can strategically place our eBPF programs to extract meaningful insights, such as source/destination IP/port, TCP flags, sequence numbers, window sizes, and even the application-level payload (with careful consideration). This detailed understanding forms the bedrock upon which effective eBPF-based TCP packet inspection is built.
eBPF: A Paradigm Shift in Kernel Observability
eBPF stands for extended Berkeley Packet Filter, and it has evolved from a specialized technology for efficient packet filtering into a versatile and powerful in-kernel virtual machine. It allows user-defined programs to be executed safely and efficiently within the Linux kernel, without requiring modifications to the kernel source code or loading potentially unstable kernel modules. This paradigm shift has unlocked unprecedented capabilities for observability, networking, and security.
What is eBPF?
At its heart, eBPF is a highly optimized, event-driven virtual machine residing in the Linux kernel. It allows developers to write small, specialized programs that are loaded into the kernel and triggered by various system events. These events can range from network packet arrivals and system calls to kernel function entries/exits, disk I/O, and CPU scheduling events. When an event occurs, the associated eBPF program executes, processing data in its context, and can then perform actions such as filtering, modifying, or summarizing data before passing control back to the kernel.
The key breakthrough of eBPF compared to its predecessor, classic BPF (cBPF), is its extensibility and programmability. While cBPF was primarily designed for packet filtering (as seen in tcpdump), eBPF offers a richer instruction set, larger program size limits, and access to a wider array of kernel data structures and helper functions. This transforms it from a simple filter to a powerful, general-purpose compute engine within the kernel.
eBPF Architecture and Safety Mechanisms
The architecture of eBPF is carefully designed to ensure system stability and security, even when running untrusted user-supplied code directly in the kernel. This is achieved through several critical components:
- eBPF Programs: These are the custom logic written by developers, typically in C and compiled into eBPF bytecode using a specialized LLVM backend. These programs are event-driven and designed to perform specific tasks.
- eBPF Maps: Programs can store and share data using eBPF maps, which are kernel-resident data structures (like hash tables, arrays, ring buffers, etc.). Maps enable communication between different eBPF programs and between eBPF programs and user-space applications. For instance, an eBPF program observing packets could store aggregated statistics in a map, which a user-space application could then read and display.
- eBPF Verifier: This is arguably the most crucial safety component. Before any eBPF program is loaded into the kernel, it must pass a rigorous verification process. The verifier performs a static analysis of the program's bytecode to ensure:
- Termination: The program will always terminate and not get stuck in an infinite loop.
- Memory Safety: The program will not access arbitrary kernel memory or perform out-of-bounds array accesses.
- Bounded Execution: The program's execution time is limited (though this is more for resource management than strict safety).
- Privilege: The program's operations are permissible for its current context and privileges. If a program fails any of these checks, it is rejected and not loaded, preventing potential kernel panics or security exploits.
- Just-In-Time (JIT) Compiler: Once an eBPF program passes verification, it is often translated into native machine code by a JIT compiler. This allows the program to run at near-native speed, achieving excellent performance without the overhead of interpretation.
- eBPF Helper Functions: eBPF programs can't call arbitrary kernel functions directly. Instead, they interact with the kernel through a predefined set of stable and safe helper functions (e.g.,
bpf_ktime_get_ns()for timestamps,bpf_map_lookup_elem()for map operations,bpf_trace_printk()for debugging). These helpers are carefully exposed by the kernel to maintain stability. - Context: When an eBPF program executes, it receives a
contextpointer as its argument. This context contains information relevant to the event that triggered the program (e.g., for a network program, it might be a pointer to thesk_buffrepresenting the packet; for akprobe, it might be the CPU registers at the time of the function call). The program operates solely within this context, accessing specific fields viabpf_probe_read_kernel()for safety.
Key Features and Benefits
- Programmability: Developers can write custom logic to suit their specific observability or control needs. This makes eBPF incredibly versatile.
- Safety: The verifier and sandboxed execution environment ensure that eBPF programs cannot crash the kernel or compromise system integrity.
- Efficiency: Running in kernel space, often JIT-compiled, eBPF programs incur minimal overhead, making them suitable for high-performance environments.
- Non-intrusiveness: eBPF allows for deep kernel instrumentation without requiring kernel module loading or system reboots, which is crucial for production systems.
- Dynamic: Programs can be loaded and unloaded on the fly, allowing for dynamic changes to monitoring or control logic without downtime.
- Wide Range of Hook Points: eBPF programs can attach to a vast array of kernel events, providing comprehensive visibility across different subsystems.
- Open Platform: The eBPF ecosystem is thriving, with an active community and a growing number of open-source tools and frameworks that leverage its power. This truly embodies an open platform approach for kernel-level development and innovation. Projects like BCC (BPF Compiler Collection) and
libbpfabstract away much of the complexity, making eBPF accessible to a broader audience of developers. This open approach, fostering collaboration and shared resources, is analogous to how modern API ecosystems thrive, allowing developers to build on robust foundations.
In essence, eBPF acts as a programmable layer within the kernel, providing a safe, efficient, and flexible way to observe, filter, and even manipulate kernel events. For inspecting incoming TCP packets, this translates into the ability to precisely observe packets at various stages of their journey through the network stack, extract relevant header fields and data, and make informed decisions, all with minimal impact on system performance.
Setting Up Your eBPF Environment
Embarking on the journey of eBPF-based TCP packet inspection requires a properly configured development environment. While the core eBPF functionality is built directly into the Linux kernel, interacting with it, compiling programs, and managing their lifecycle typically involves specific tools and libraries. Understanding these prerequisites is essential for a smooth and productive eBPF development experience.
Kernel Version and Configuration
The first and most critical requirement is a sufficiently modern Linux kernel. eBPF has seen rapid development, with new features and helper functions being added in almost every major kernel release. While basic eBPF functionality has been present since kernel 3.18, for robust network-related eBPF programs (especially XDP and certain tracepoints), a kernel version of 4.9 or newer is generally recommended. For the latest features and improved ergonomics, kernel 5.x or higher is ideal.
Before you begin, verify your kernel version:
uname -r
Additionally, your kernel must be compiled with the necessary eBPF-related options enabled. Most modern distribution kernels (Ubuntu, Fedora, CentOS/RHEL 8+, Debian) come with these enabled by default. Key configuration options typically include: * CONFIG_BPF_SYSCALL=y * CONFIG_BPF_JIT=y (for JIT compilation, crucial for performance) * CONFIG_BPF_EVENTS=y * CONFIG_HAVE_BPF_JIT=y * CONFIG_BPF_MAP_ALLOCATOR=y * CONFIG_BPF_UNPRIV_DEFAULT_OFF=y (important for security, requiring CAP_BPF or root for loading programs)
You can check your kernel's configuration (usually /boot/config-$(uname -r) or by examining /proc/config.gz if available) to confirm these.
Essential Toolchains and Libraries
Developing eBPF programs involves compiling C code into eBPF bytecode, loading it into the kernel, and communicating with it from user space. Several key tools and libraries facilitate this process:
libbpf and bpftool: libbpf is a C library that provides a more lightweight and efficient way to write eBPF user-space loaders. It's often preferred for production deployments and for building self-contained eBPF applications that don't need runtime Clang/LLVM. bpftool is a command-line utility for inspecting and managing eBPF programs and maps loaded in the kernel. It's an indispensable tool for debugging and understanding the state of your eBPF environment. libbpf is usually included with bpftool or available as a separate development package. ```bash # On Debian/Ubuntu sudo apt install bpftool libbpf-dev
On Fedora
sudo dnf install bpftool libbpf-devel
On CentOS/RHEL
sudo yum install bpftool libbpf-devel `` To checkbpftoolinstallation:bpftool --version`.
BCC (BPF Compiler Collection): BCC is a powerful toolkit that simplifies eBPF program development by providing a Python front-end, C libraries, and a collection of eBPF example tools. It handles much of the boilerplate, like compiling eBPF C code on-the-fly, loading programs, and communicating with eBPF maps. While it's excellent for rapid prototyping and many use cases, it has a runtime dependency on Clang/LLVM on the target system. ```bash # On Debian/Ubuntu sudo apt install bpfcc-tools linux-headers-$(uname -r)
On Fedora
sudo dnf install bcc-tools python3-bcc kernel-devel
On CentOS/RHEL (requires EPEL)
sudo yum install bcc-tools python3-bcc kernel-devel `` You can then test your BCC installation with a simplesudo execsnooporsudo opensnoop`.
Kernel Headers: Your system needs to have the kernel headers installed that match your currently running kernel version. These headers provide the necessary definitions for kernel data structures (like sk_buff, sock, tcp_sock) that your eBPF programs will interact with. Without them, your eBPF C code won't compile. ```bash # On Debian/Ubuntu sudo apt install linux-headers-$(uname -r)
On Fedora
sudo dnf install kernel-devel-$(uname -r)
On CentOS/RHEL
sudo yum install kernel-devel-$(uname -r) ```
Clang/LLVM: These are the primary compilers for eBPF programs. Clang (the C/C++/Objective-C frontend) and LLVM (the backend infrastructure) are required to compile your eBPF C code into the .o bytecode format that the kernel understands. Ensure you have a recent version (typically 10.0 or higher is good, but newer is better for latest eBPF features). ```bash # On Debian/Ubuntu sudo apt update sudo apt install clang llvm libelf-dev zlib1g-dev
On Fedora
sudo dnf install clang llvm elfutils-libelf-devel zlib-devel
On CentOS/RHEL (requires EPEL)
sudo yum install clang llvm elfutils-libelf-devel zlib-devel ```
Basic Setup Guide for a Development Machine
- Update Your System: Ensure your operating system and packages are up to date.
- Install Compilers and Libraries: Follow the commands above to install
clang,llvm,libelf-dev,zlib1g-dev,kernel-headers,libbpf-dev. - Install BCC (Optional but Recommended for Learning): Install
bcc-toolsandpython3-bcc. - Verify Setup:
- Run
uname -rand ensure kernel headers match. - Run
clang --versionto confirm Clang is installed. - Try a basic BCC tool like
sudo opensnooporsudo execsnoopto confirm eBPF is functional. - Check
bpftool --version.
- Run
With these tools and libraries in place, your system is ready to compile, load, and interact with eBPF programs. This robust setup provides the foundation for exploring the various eBPF program types and techniques detailed in the subsequent sections for inspecting incoming TCP packets with precision and confidence.
eBPF Program Types for Network Inspection
eBPF's flexibility comes from its ability to attach programs to various "hook points" within the kernel, each offering a distinct perspective and level of control over network traffic. For inspecting incoming TCP packets, several eBPF program types are particularly relevant, each with its own strengths, weaknesses, and ideal use cases. Understanding these differences is crucial for selecting the right tool for the job.
1. kprobe/kretprobe
Concept: kprobe (kernel probe) and kretprobe (kernel return probe) allow eBPF programs to attach to the entry or exit points of almost any kernel function. When the target function is called or returns, the eBPF program executes, with access to the function's arguments (at entry) or return value (at exit) and the CPU registers.
Application for TCP Inspection: This is one of the most powerful and versatile methods for deep inspection. By attaching kprobes to specific kernel functions within the TCP/IP stack, we can observe critical events and data structures at precise moments. For incoming TCP packets, relevant functions include: * tcp_v4_rcv (or tcp_v6_rcv): The primary entry point for TCP segments arriving for an IPv4 (or IPv6) connection. This is an excellent place to see raw TCP segments as they begin processing. * tcp_rcv_established: Called when a TCP segment arrives for an established connection. Useful for monitoring data flow. * inet_csk_accept: Called when a new connection is accepted by a listening socket. Useful for tracking new connections. * tcp_retransmit_skb: Called when a TCP segment is retransmitted. Useful for detecting network issues.
Strengths: * Granular Control: Can observe specific logic paths and data structures deep within the kernel. * Rich Context: Provides access to function arguments, internal kernel data structures (like struct sock, struct tcp_sock, struct sk_buff), and CPU registers. * Versatility: Applicable to almost any kernel function, making it highly adaptable for complex scenarios.
Weaknesses: * Kernel Version Dependency: Function signatures and internal data structures can change between kernel versions, requiring code adjustments. * Overhead: Attaching to frequently called functions can introduce measurable overhead if the eBPF program is not optimized. * Complexity: Requires deep knowledge of kernel internals to identify relevant functions and safely extract data.
2. tc (Traffic Control) Programs / cls_bpf and act_bpf
Concept: tc programs are attached to network interfaces using the Linux traffic control subsystem. They can operate at different stages of the packet processing pipeline, both ingress (incoming) and egress (outgoing). Specifically, cls_bpf allows eBPF programs to act as classifiers, and act_bpf as actions.
Application for TCP Inspection: tc ingress programs are ideal for inspecting incoming packets after they have been received by the NIC and passed initial driver processing, but before they enter the main IP and TCP stack processing. * Can filter packets based on various header fields (MAC, IP, TCP, UDP). * Can gather statistics, redirect packets, or even drop them. * Useful for QoS, load balancing, and basic security filtering.
Strengths: * Placement: Excellent for early-stage filtering and processing of incoming packets. * Performance: Can be very efficient for filtering traffic before it consumes further kernel resources. * Integrated with tc: Benefits from the existing tc framework for complex network policies.
Weaknesses: * Limited Context: Does not have direct access to the struct sock or struct tcp_sock context like kprobes deeper in the stack. It operates primarily on the sk_buff (socket buffer) which contains packet data. * Configuration Complexity: Setting up tc filters can be intricate, especially with multiple rules.
3. socket filters (SO_ATTACH_BPF)
Concept: This program type allows an eBPF program to be attached directly to a specific socket. Any incoming (or outgoing, depending on the hook) packet that would be processed by that socket is first passed to the attached eBPF program.
Application for TCP Inspection: * Highly effective for application-specific monitoring. For example, if you want to inspect TCP packets exclusively for an nginx process or a specific microservice. * Can filter packets for a particular application, extract specific payload data, or gather per-socket statistics. * Works well with net_filter programs (previously socket_filter) for SO_ATTACH_BPF and SO_ATTACH_REUSEPORT_CBPF.
Strengths: * Application-centric: Provides visibility into the exact traffic destined for a specific application. * Precise Scope: Only inspects traffic for the attached socket, reducing noise. * User-space Control: The user-space application can attach the filter directly to its own socket.
Weaknesses: * Limited Scope: Only sees packets for the specific socket it's attached to. Not suitable for system-wide or broad network monitoring. * Not for Early Stages: Packets have already passed through much of the network stack before reaching the socket filter.
4. XDP (eXpress Data Path)
Concept: XDP programs are the earliest possible hook point for an incoming packet in the Linux kernel network stack. They execute directly on the network driver's receive path, even before the packet is allocated a full sk_buff structure. This makes XDP incredibly fast and efficient for high-volume packet processing.
Application for TCP Inspection: * Early Filtering/Dropping: Ideal for high-performance DDoS mitigation, firewalling, or load balancing, where malicious or unwanted TCP traffic needs to be dropped as early as possible. * Basic Header Inspection: Can extract IP and TCP headers to make decisions (e.g., block SYN floods, filter by port). * Packet Redirection: Can redirect packets to other network interfaces or to different CPU cores for processing.
Strengths: * Extreme Performance: Unparalleled speed for packet processing due to its very early execution point. * Minimal Overhead: Operates at a low level, consuming minimal system resources. * DDoS Mitigation: Excellent for pre-emptively dropping malicious traffic.
Weaknesses: * Limited Context: Operates on raw packet data in the driver's memory, with very limited kernel context. It cannot easily access struct sock or other higher-level kernel data. * Complex Data Structures: Working with raw packet pointers requires careful handling of network header offsets. * Driver Support: Requires specific network card driver support, though this is becoming increasingly common. * Not for Deep TCP State: Cannot easily track TCP connection state (established, closed, etc.) as it executes before the TCP stack processes the segment.
Comparison Table of eBPF Program Types for TCP Inspection
To summarize the utility of these different eBPF program types for inspecting incoming TCP packets, consider the following comparison:
| Program Type | Hook Point | Strengths | Weaknesses | Ideal Use Case(s) |
|---|---|---|---|---|
| kprobe/kretprobe | Entry/Exit of any kernel function | Granular control, rich kernel context (sock, tcp_sock, sk_buff), versatile | Kernel version dependency, potential overhead, complex kernel internals | Deep troubleshooting, detailed connection analysis, custom metrics |
| tc (ingress) | Network interface (post-driver, pre-stack) | Early filtering, performance, integrated with tc subsystem |
Limited access to deep TCP state, configuration complexity | QoS, load balancing, early-stage security filtering |
| Socket Filters | Specific socket | Application-centric, precise scope, user-space controlled | Limited to specific sockets, not for system-wide monitoring | Per-application traffic analysis, custom application firewalls |
| XDP | NIC driver receive path (earliest) | Extreme performance, minimal overhead, DDoS mitigation | Very limited kernel context, driver support, no deep TCP state | High-volume packet filtering, DDoS protection, fast forwarding |
Choosing the correct eBPF program type is critical for the success of your packet inspection efforts. A kprobe might be perfect for debugging a specific TCP retransmission issue, while XDP would be the go-to for dropping a large-scale SYN flood. tc programs could enforce ingress policy, and socket filters could provide per-application API traffic visibility, which might then feed into higher-level API management systems. Each type offers a unique lens through which to observe the flow of incoming TCP packets, allowing for targeted and efficient analysis.
APIPark is a high-performance AI gateway that allows you to securely access the most comprehensive LLM APIs globally on the APIPark platform, including OpenAI, Anthropic, Mistral, Llama2, Google Gemini, and more.Try APIPark now! 👇👇👇
Deep Dive: Inspecting Incoming TCP Packets with kprobe and sock_ops
For granular, state-aware inspection of incoming TCP packets, kprobes offer unparalleled access to the kernel's internal TCP processing logic. By strategically attaching eBPF programs to key functions within the TCP stack, we can observe the entire lifecycle of an incoming segment, from its initial reception to its final processing by a socket. While sock_ops is a separate eBPF program type, it's often used in conjunction with kprobe-like approaches for connection-level events, providing complementary insights.
Targeting Kernel Functions for TCP Inspection
The Linux kernel's TCP stack is a complex and highly optimized piece of software. To inspect incoming packets effectively, we need to identify the functions responsible for their reception and processing. Here are some of the most relevant functions for IPv4 TCP:
tcp_v4_rcv(struct sk_buff *skb):- Purpose: This is the primary entry point for all incoming IPv4 TCP segments. When an IP packet is identified as a TCP segment, it is passed to this function.
- Insight: Attaching a
kprobehere allows you to see every incoming TCP segment for all connections. You can access thesk_buff(socket buffer) which contains the raw packet data, IP header, and TCP header. This is an excellent place to count total incoming segments, inspect initial headers, or filter for specific flags (e.g., SYN for new connections).
tcp_rcv_established(struct sock *sk, struct sk_buff *skb, struct tcphdr *th, unsigned int len):- Purpose: This function handles incoming TCP segments for connections that are already in the
ESTABLISHEDstate. It performs sequence number validation, window updates, acknowledgment processing, and delivers data to the application. - Insight: By probing this function, you can focus on the actual data flow of established connections. You have access to the
struct sock(the generic socket structure),struct sk_buff, and thestruct tcphdr(TCP header). This allows you to track sequence numbers, acknowledgment numbers, window sizes, and potentially identify retransmissions or out-of-order packets.
- Purpose: This function handles incoming TCP segments for connections that are already in the
inet_csk_accept(struct sock *sk, int flags, bool *err, bool kern):- Purpose: This function is called when a listening socket successfully accepts a new incoming connection.
- Insight: A
kprobehere can track the precise moment a new TCP connection is fully accepted by the server application. You can extract information about the new client socket (via theskargument) and its peer's IP and port. This is invaluable for monitoring connection rates and identifying potential connection issues.
tcp_drop(struct sock *sk, struct sk_buff *skb):- Purpose: A generic function (though there are others more specific) that might be called when a TCP segment is dropped due to various reasons (e.g., invalid checksum, out-of-window sequence number, lack of memory).
- Insight: Probing this (or related functions like
tcp_validate_incoming) can help identify why and when incoming TCP segments are being silently dropped by the kernel, which is often a source of mysterious application performance issues.
Extracting Packet Data and Socket Information
Once attached to a kernel function via a kprobe, your eBPF program receives a context argument (often struct pt_regs for architectures like x86-64). From this context, you can access the function's arguments. For network functions, these arguments typically include pointers to key data structures:
struct sk_buff: The socket buffer is the kernel's primary structure for representing a network packet. It contains the raw packet data, along with pointers and offsets to various headers (MAC, IP, TCP, UDP).- Accessing Headers: Within an eBPF program, you'll need to carefully read memory using
bpf_probe_read_kernel()or similar helpers to extract header data. For example, to get the IP header (struct iphdr) and TCP header (struct tcphdr): ```c // Assuming 'skb' is the struct sk_buff pointer void data_start = (void )(long)skb->head + skb->network_header; void data_end = (void )(long)skb->head + skb->len;// Read IP header struct iphdr ip = data_start; if ((void)(ip + 1) > data_end) return 0; // Check bounds if (ip->protocol != IPPROTO_TCP) return 0; // Ensure it's TCP// Read TCP header struct tcphdr tcp = (void)(ip + 1); if ((void*)(tcp + 1) > data_end) return 0; // Check bounds`` * **Key Fields:** Fromstruct iphdr, you can get source/destination IP addresses. Fromstruct tcphdr`, you can get source/destination ports, sequence number, acknowledgment number, flags (SYN, ACK, FIN, RST, PSH), and window size.
- Accessing Headers: Within an eBPF program, you'll need to carefully read memory using
struct sock/struct tcp_sock:struct sockis the generic kernel representation of a network socket.struct tcp_sockis a TCP-specific extension embedded withinstruct sock. These structures hold critical state information about a connection.- Accessing Information: ```c // Assuming 'sk' is the struct sock pointer u16 sport = BPF_CORE_READ(sk, __sk_common.skc_num); // Source port u16 dport = BPF_CORE_READ(sk, __sk_common.skc_dport); // Destination port (network byte order) // Convert dport to host byte order: bpf_ntohs(dport)u32 saddr = BPF_CORE_READ(sk, __sk_common.skc_rcv_saddr); // Source IP (for listen sockets) u32 daddr = BPF_CORE_READ(sk, __sk_common.skc_daddr); // Destination IP// For connected sockets, peer's IP and port are more relevant: u32 peer_saddr = BPF_CORE_READ(sk, __sk_common.skc_daddr); // Peer's IP (source for us) u16 peer_sport = BPF_CORE_READ(sk, __sk_common.skc_dport); // Peer's port (source for us)
`` * **TCP State:** You can readsk->sk_stateto determine the current TCP state (e.g.,TCP_ESTABLISHED,TCP_SYN_SENT,TCP_CLOSE). * **TCP-specific metrics:** Withinstruct tcp_sock, you might find fields likesrtt_us(smoothed round-trip time),rcv_nxt(next expected sequence number), orsnd_una(unacknowledged sequence number) to track connection performance. Accessingstruct tcp_sockrequires castingstruct socktostruct tcp_sock(e.g.,(struct tcp_sock *)sk), but this must be done carefully withBPF_CORE_READ_KERNELorBPF_CORE_READ` to ensure safety and portability.
- Accessing Information: ```c // Assuming 'sk' is the struct sock pointer u16 sport = BPF_CORE_READ(sk, __sk_common.skc_num); // Source port u16 dport = BPF_CORE_READ(sk, __sk_common.skc_dport); // Destination port (network byte order) // Convert dport to host byte order: bpf_ntohs(dport)u32 saddr = BPF_CORE_READ(sk, __sk_common.skc_rcv_saddr); // Source IP (for listen sockets) u32 daddr = BPF_CORE_READ(sk, __sk_common.skc_daddr); // Destination IP// For connected sockets, peer's IP and port are more relevant: u32 peer_saddr = BPF_CORE_READ(sk, __sk_common.skc_daddr); // Peer's IP (source for us) u16 peer_sport = BPF_CORE_READ(sk, __sk_common.skc_dport); // Peer's port (source for us)
Practical Code Example (Conceptual with BCC/libbpf considerations)
Here's a conceptual eBPF program structure using a kprobe on tcp_v4_rcv to count incoming SYN packets and report basic details:
eBPF C Program (tcp_syn_kprobe.bpf.c):
#include <linux/bpf.h>
#include <linux/ip.h>
#include <linux/tcp.h>
#include <linux/in.h> // For AF_INET
#include <bpf/bpf_helpers.h>
#include <bpf/bpf_core_read.h> // For BPF_CORE_READ

char _license[] SEC("license") = "GPL";

struct packet_data {
    u32 saddr;
    u32 daddr;
    u16 sport;
    u16 dport;
    u8  flags; // SYN, ACK, FIN, RST
};

// Define a perf event array to send data to user space
struct {
    __uint(type, BPF_MAP_TYPE_PERF_EVENT_ARRAY);
    __uint(key_size, sizeof(u32));
    __uint(value_size, sizeof(u32));
} events SEC(".maps");

SEC("kprobe/tcp_v4_rcv")
int bpf_tcp_v4_rcv(struct pt_regs *ctx) {
    struct sk_buff *skb = (struct sk_buff *)PT_REGS_PARM1(ctx);

    // Read sk_buff fields safely
    void *data_start = (void *)(long)BPF_CORE_READ(skb, head) + BPF_CORE_READ(skb, network_header);
    void *data_end = (void *)(long)BPF_CORE_READ(skb, head) + BPF_CORE_READ(skb, len);

    // Ensure we have enough data for IP header
    struct iphdr *ip = data_start;
    if ((void*)(ip + 1) > data_end) {
        return 0; // Malformed or too short
    }

    // Only process TCP packets
    if (BPF_CORE_READ(ip, protocol) != IPPROTO_TCP) {
        return 0;
    }

    // Ensure we have enough data for TCP header
    struct tcphdr *tcp = (void*)(ip + 1);
    if ((void*)(tcp + 1) > data_end) {
        return 0; // Malformed or too short
    }

    // Check if it's a SYN packet and not an ACK
    if (BPF_CORE_READ(tcp, syn) && !BPF_CORE_READ(tcp, ack)) {
        struct packet_data data = {};
        data.saddr = BPF_CORE_READ(ip, saddr);
        data.daddr = BPF_CORE_READ(ip, daddr);
        data.sport = BPF_CORE_READ(tcp, source); // Network byte order
        data.dport = BPF_CORE_READ(tcp, dest);   // Network byte order
        data.flags = (BPF_CORE_READ(tcp, syn) << 0) |
                     (BPF_CORE_READ(tcp, ack) << 1) |
                     (BPF_CORE_READ(tcp, fin) << 2) |
                     (BPF_CORE_READ(tcp, rst) << 3);

        bpf_perf_event_output(ctx, &events, BPF_F_CURRENT_CPU, &data, sizeof(data));
    }

    return 0;
}
User-space Python Loader (using BCC):
from bcc import BPF
import ctypes as ct
import socket
import struct

# eBPF C program (could be loaded from a file or inline string)
bpf_text = """
// ... (paste the C program from above here) ...
"""

# Define event data structure for user space
class PacketData(ct.Structure):
    _fields_ = [
        ("saddr", ct.c_uint32),
        ("daddr", ct.c_uint32),
        ("sport", ct.c_uint16),
        ("dport", ct.c_uint16),
        ("flags", ct.c_uint8),
    ]

# Initialize BPF
b = BPF(text=bpf_text)

# Attach kprobe to tcp_v4_rcv
b.attach_kprobe(event="tcp_v4_rcv", fn_name="bpf_tcp_v4_rcv")

print("Monitoring incoming TCP SYN packets... Press Ctrl-C to stop.")

# Function to convert IP address
def addr_to_str(addr):
    return socket.inet_ntop(socket.AF_INET, struct.pack("=I", addr))

# Define callback function for events
def print_event(cpu, data, size):
    event = ct.cast(data, ct.POINTER(PacketData)).contents
    print(f"SYN Packet: {addr_to_str(event.saddr)}:{socket.ntohs(event.sport)} -> "
          f"{addr_to_str(event.daddr)}:{socket.ntohs(event.dport)}")

# Open perf buffer
b["events"].open_perf_buffer(print_event)

# Loop and read events
try:
    while True:
        b.perf_buffer_poll()
except KeyboardInterrupt:
    pass

print("Stopped monitoring.")
This example demonstrates how to: 1. Define an eBPF program in C. 2. Use kprobe to attach to tcp_v4_rcv. 3. Safely read sk_buff, iphdr, and tcphdr fields. 4. Filter for SYN packets. 5. Use a perf_event_array map to send structured data to user space. 6. Use a Python script with BCC to load the program, attach the probe, and read the events.
sock_ops Programs for Connection-Level Events
The sock_ops program type is a specialized eBPF program that is invoked for specific socket operations, particularly during the TCP handshake and state transitions. It's often associated with BPF_PROG_TYPE_SOCK_OPS and attached via setsockopt(..., SOL_SOCKET, SO_ATTACH_SOCK_OPS, ...).
Application for TCP Inspection: * Connection Lifecycle: sock_ops programs can receive notifications for events like BPF_SOCK_OPS_SYN_CONNECT, BPF_SOCK_OPS_ACTIVE_ESTABLISHED, BPF_SOCK_OPS_PASSIVE_ESTABLISHED, BPF_SOCK_OPS_TCP_LISTEN, BPF_SOCK_OPS_HALF_CLOSED, and BPF_SOCK_OPS_CONNECTION_RESET. * Connection Tuning: Can be used to influence TCP connection parameters, such as initial window size, or to gather statistics on connection establishment times. * Packet Meta-data: Provides access to struct bpf_sock_ops which contains IP addresses, ports, and the current TCP state, allowing for precise connection-level logging.
Integration with kprobe: While kprobes on tcp_v4_rcv give you a per-packet view, sock_ops provides a per-connection, state-change view. For comprehensive monitoring, you might use kprobes to analyze individual segments and sock_ops to track the health and lifecycle of the overall TCP connection, providing a holistic picture of incoming traffic from different angles. For example, a kprobe might tell you every SYN packet, but sock_ops would tell you when a SYN successfully leads to an ESTABLISHED connection.
The combination of kprobe for deep packet dissection and sock_ops for robust connection state tracking forms a powerful duo for meticulously inspecting and understanding incoming TCP packets and the connections they belong to. These low-level insights are fundamental for building resilient and performant networked applications and services.
Deep Dive: Inspecting Incoming TCP Packets with XDP
While kprobes offer surgical precision deep within the kernel's TCP stack, XDP (eXpress Data Path) provides an entirely different, yet equally powerful, approach to inspecting incoming TCP packets: at the absolute earliest possible point in the kernel's receive path. This "zero-copy" philosophy makes XDP an indispensable tool for high-performance packet processing, often before the kernel even allocates a full sk_buff structure or incurs significant processing overhead.
XDP's Role at the Earliest Receive Stage
When a network interface card (NIC) receives a packet, it typically places it into a receive ring buffer in memory. In a traditional Linux network stack, the kernel's driver then processes this packet, potentially allocates an sk_buff, performs checksum offloading, and then passes it up the stack. XDP intercepts this process much earlier. An XDP program executes directly from the receive queue of the network driver, operating on the raw packet data residing in the NIC's DMA-mapped memory.
This early interception means several things: * Minimal Overhead: The packet has not yet been copied, processed by many layers of the kernel, or had an sk_buff allocated (in native XDP mode). This significantly reduces CPU cycles per packet. * High Performance: Ideal for extremely high packet rates, as decisions can be made (drop, pass, redirect) with minimal latency. * DDoS Mitigation: XDP is exceptionally well-suited for mitigating network attacks like SYN floods or UDP reflection attacks by dropping malicious traffic at the earliest possible point, preventing it from consuming valuable kernel or application resources.
XDP Program Actions
An XDP program, after processing a packet, returns one of several predefined actions, which dictate what happens to the packet next:
XDP_PASS: The packet is allowed to continue its normal journey up the kernel's network stack. This is the default action if no other decision is made.XDP_DROP: The packet is immediately dropped by the driver, without any further kernel processing. This is a common action for filtering unwanted traffic.XDP_TX: The packet is transmitted back out of the same network interface it arrived on. Useful for reflecting traffic or certain types of load balancing.XDP_REDIRECT: The packet is redirected to another network interface or to a different CPU's processing queue. This enables high-performance forwarding or distributing load.XDP_ABORTED: An error occurred within the XDP program, and the packet should be dropped.
Advantages for High-Performance Filtering/Forwarding
For incoming TCP packets, XDP's primary advantage lies in its ability to perform extremely fast, early-stage filtering and redirection. Imagine a scenario where a server is under a SYN flood attack. A traditional firewall or kprobe deeper in the stack would still incur the overhead of the kernel receiving and initially processing each malicious SYN packet. An XDP program, however, can inspect the incoming packet's headers at the driver level, identify it as a SYN packet destined for a saturated port, and XDP_DROP it before it even touches the main TCP stack. This significantly offloads the CPU and protects the system.
Other high-performance use cases include: * Load Balancing: Redirecting incoming TCP connection requests (SYN packets) across multiple backend servers based on layer 3/4 headers. * Proactive Security: Identifying and dropping packets from known malicious IP ranges or with suspicious header characteristics before they reach the application. * Custom Routers/Switches: Building highly efficient software-defined networking components.
Challenges for Full Packet Inspection (Limited Context)
While incredibly fast, XDP's early execution comes with trade-offs, particularly for "full packet inspection" in the sense of understanding TCP state or interacting with the struct sock context.
- Raw Packet Data: XDP programs primarily operate on raw packet data directly from the network buffer. This means you get pointers to the start of the packet, and you must manually parse the Ethernet, IP, and TCP headers by calculating offsets. There's no convenient
sk_buffstructure (in native XDP mode) with pre-parsed pointers to headers. - Limited Kernel Context: An XDP program cannot easily access higher-level kernel data structures like
struct sockorstruct tcp_sock, which contain the state of TCP connections. It executes before the packet has been associated with a specific socket or a connection's state has been updated. This means an XDP program cannot determine if an incoming TCP segment belongs to anESTABLISHEDconnection, if it's a retransmission, or what the current window size is for that connection. - No
bpf_probe_read_kernel(for non-packet data): While you can read packet data, accessing arbitrary kernel memory is heavily restricted. Helper functions are limited.
Example Use Cases and Conceptual Code
Despite its limitations for deep TCP state analysis, XDP is perfect for initial triage of incoming TCP traffic.
Conceptual XDP Program for SYN Flood Mitigation:
#include <linux/bpf.h>
#include <linux/if_ether.h>
#include <linux/ip.h>
#include <linux/tcp.h>
#include <linux/in.h> // For AF_INET
#include <bpf/bpf_helpers.h>

char _license[] SEC("license") = "GPL";

SEC("xdp")
int xdp_tcp_syn_filter(struct xdp_md *ctx) {
    void *data_end = (void *)(long)ctx->data_end;
    void *data = (void *)(long)ctx->data;

    // Ethernet header
    struct ethhdr *eth = data;
    if ((void *)(eth + 1) > data_end) {
        return XDP_PASS; // Malformed packet
    }

    // IP header
    struct iphdr *ip = data + sizeof(struct ethhdr);
    if ((void *)(ip + 1) > data_end) {
        return XDP_PASS; // Malformed packet
    }

    // Only process IPv4 TCP packets
    if (eth->h_proto != bpf_htons(ETH_P_IP) || ip->protocol != IPPROTO_TCP) {
        return XDP_PASS;
    }

    // TCP header
    struct tcphdr *tcp = (void *)ip + (ip->ihl * 4); // ip->ihl is in 4-byte words
    if ((void *)(tcp + 1) > data_end) {
        return XDP_PASS; // Malformed packet
    }

    // Check if it's a SYN packet and not an ACK
    if (tcp->syn && !tcp->ack) {
        // Option 1: Log and Drop (simple mitigation)
        // bpf_printk("XDP: Dropping SYN from %pI4:%d to %pI4:%d\n", &ip->saddr, bpf_ntohs(tcp->source), &ip->daddr, bpf_ntohs(tcp->dest));
        return XDP_DROP;
        // Option 2: Redirect to a specialized handler or another interface
        // return bpf_redirect_map(&redirect_map, 0, 0);
    }

    return XDP_PASS; // Let other packets pass
}
This conceptual XDP program demonstrates: 1. How to access xdp_md context for packet data pointers. 2. Manual parsing of Ethernet, IP, and TCP headers using pointer arithmetic. 3. Filtering for SYN packets. 4. Returning XDP_DROP for unwanted traffic.
While XDP programs can't track TCP connection state directly, they can maintain simple states using eBPF maps. For example, an XDP program could use a hash map to count SYNs per source IP or to implement a rate-limiting mechanism to prevent floods. The key is that these states are application-specific (the eBPF program's application), not the kernel's internal TCP connection state machine.
In summary, XDP is the tool of choice when extreme performance and early-stage decision-making are paramount for incoming TCP packets. It excels at traffic shaping, basic filtering, and DDoS mitigation, complementing the deeper inspection capabilities of kprobes and sock_ops programs. Choosing between these depends on the specific requirements of your packet inspection task: speed and early action (XDP) vs. deep stateful analysis (kprobe/sock_ops).
Deep Dive: Inspecting Incoming TCP Packets with socket filters (SO_ATTACH_BPF)
While XDP and kprobes operate at a more global or kernel-deep level, socket filters (specifically, eBPF programs attached via SO_ATTACH_BPF) offer a unique, application-centric approach to inspecting incoming TCP packets. This method allows you to attach an eBPF program directly to a specific socket, enabling highly granular, process-isolated traffic monitoring. This is particularly valuable in microservices architectures or multi-tenant environments where you need to understand the network behavior of individual applications without affecting others.
Attaching eBPF Programs Directly to Sockets
The SO_ATTACH_BPF socket option allows a user-space application to load and attach an eBPF program of type BPF_PROG_TYPE_SOCKET_FILTER (or the older BPF_PROG_TYPE_RAW_TRACEPOINT in some contexts, though BPF_PROG_TYPE_SOCKET_FILTER is the primary for this use case) to one of its own sockets. Once attached, every packet that arrives at that specific socket (and would normally be passed to the application) is first processed by the attached eBPF program.
This is distinct from kprobes because it doesn't attach to a kernel function; instead, it attaches to a kernel object (the socket) that represents an endpoint for communication. It's also different from XDP, which operates at the NIC driver level; socket filters operate much higher in the network stack, after the packet has been processed by IP and TCP layers and determined to be destined for that particular socket.
Advantages for Application-Specific Inspection
The key benefit of SO_ATTACH_BPF is its laser focus on a single application's traffic.
- Isolation: The eBPF program only sees packets relevant to the attached socket. This drastically reduces the volume of traffic the eBPF program needs to process, simplifying logic and minimizing overhead compared to a system-wide
kprobeontcp_v4_rcv. This is especially useful in environments with many applications or high overall network traffic where you only care about one service. - Contextual Relevance: Since the packet has already gone through the IP and TCP layers, the eBPF program implicitly knows it's a valid TCP packet for that socket. It can directly access the
sk_buffstructure, and more importantly, thesockstructure (though usually through helper functions or context rather than direct pointer access in older versions, modern kernels simplify this). - Security/Compliance: For services that handle sensitive data, a socket filter can be used to monitor or even restrict communication based on application-level protocols after TCP/IP processing, but before the data hits the application's buffer. For example, ensuring that only TLS-encrypted traffic (by checking for initial handshake patterns) reaches a sensitive application.
- Application-Specific Metrics: Collect metrics specific to an application's network usage, such as bytes received, number of requests, or even specific API call patterns if the application protocol is simple enough to parse within the eBPF program. This bridges the gap between raw packet data and application-level insights, which can then feed into higher-level API management platforms for comprehensive monitoring.
Limitations
While powerful, socket filters have inherent limitations:
- Limited Scope: As mentioned, they only see traffic for the specific socket they're attached to. You cannot use them for general network troubleshooting across the entire system.
- Packet already Processed: The packets have already been through the full TCP/IP stack. This means you can't use
SO_ATTACH_BPFto diagnose issues like "why did the kernel drop this packet before it even reached my application?" because by the time the packet hits the socket filter, it's already been accepted by the TCP stack for that socket. - Application Cooperation: The application itself needs to explicitly attach the eBPF program. This might require modifying the application's code, or using a wrapper/agent that does it on behalf of the application.
Example for a Specific Process (Conceptual)
Consider an HTTP server. We want to inspect the first few bytes of every incoming TCP packet to detect potential HTTP/2 PRI string or other protocol handshakes without the overhead of full user-space parsing.
eBPF C Program (http_socket_filter.bpf.c):
#include <linux/bpf.h>
#include <linux/if_ether.h> // For ETH_P_IP etc. (though often not needed for socket filters)
#include <linux/ip.h>
#include <linux/tcp.h>
#include <bpf/bpf_helpers.h>
#include <bpf/bpf_core_read.h>

char _license[] SEC("license") = "GPL";

struct packet_info {
    u32 saddr;
    u32 daddr;
    u16 sport;
    u16 dport;
    u32 payload_len;
    char payload_prefix[16]; // Store first 15 bytes of payload + null terminator
};

struct {
    __uint(type, BPF_MAP_TYPE_PERF_EVENT_ARRAY);
    __uint(key_size, sizeof(u32));
    __uint(value_size, sizeof(u32));
} http_events SEC(".maps");


// BPF_PROG_TYPE_SOCKET_FILTER programs receive an sk_buff pointer directly
// This hook point gets called after IP/TCP processing, but before data lands in app buffer
SEC("socket")
int bpf_http_filter(struct __sk_buff *skb) {
    // __sk_buff provides direct access to network/transport headers
    // Use skb->data for start of packet, skb->data_end for end

    // Ensure it's a TCP packet (should already be for a TCP socket)
    if (skb->protocol != bpf_htons(ETH_P_IP)) { // Check eth_p_ip for IPv4
        return 0;
    }

    struct iphdr *ip = (void *)(long)skb->data + ETH_HLEN; // Assuming Ethernet header
    if ((void *)(ip + 1) > (void *)(long)skb->data_end) {
        return 0;
    }
    if (ip->protocol != IPPROTO_TCP) {
        return 0;
    }

    struct tcphdr *tcp = (void *)ip + (ip->ihl * 4);
    if ((void *)(tcp + 1) > (void *)(long)skb->data_end) {
        return 0;
    }

    // Ensure it's an ACK packet with data (not just a pure ACK) and PSH flag might be set
    if (!BPF_CORE_READ(tcp, ack) || (BPF_CORE_READ(tcp, doff) * 4 + skb->len - (ip->ihl * 4) - (BPF_CORE_READ(tcp, doff) * 4)) == 0) {
        return 0; // Not an ACK or no payload
    }

    // Calculate payload start and length
    void *payload_start = (void *)tcp + (BPF_CORE_READ(tcp, doff) * 4);
    u32 payload_len = (u32)((void *)(long)skb->data_end - payload_start);

    // Only process if there's actual payload data
    if (payload_len == 0) {
        return 0;
    }

    struct packet_info info = {};
    info.saddr = BPF_CORE_READ(ip, saddr);
    info.daddr = BPF_CORE_READ(ip, daddr);
    info.sport = BPF_CORE_READ(tcp, source);
    info.dport = BPF_CORE_READ(tcp, dest);
    info.payload_len = payload_len;

    // Read first few bytes of payload
    int prefix_len = sizeof(info.payload_prefix) - 1;
    if (payload_len < prefix_len) prefix_len = payload_len;
    bpf_probe_read_kernel(&info.payload_prefix, prefix_len, payload_start);

    bpf_perf_event_output(skb, &http_events, BPF_F_CURRENT_CPU, &info, sizeof(info));

    return -1; // -1 means allow the packet to pass to the socket (historical BPF semantics)
               // For modern eBPF sockets, 0 also means pass.
               // A non-zero return value might mean drop (depends on specific kernel interpretation/sockopt)
}
User-space C Loader (using libbpf for an AF_INET socket): This would involve: 1. Creating a standard TCP listening socket (socket(AF_INET, SOCK_STREAM, 0)). 2. Binding and listening (bind, listen). 3. Loading the eBPF program compiled from http_socket_filter.bpf.c using bpf_object__open, bpf_object__load, bpf_program__attach. 4. Getting the file descriptor of the eBPF program (bpf_program__fd). 5. Using setsockopt(listen_sock_fd, SOL_SOCKET, SO_ATTACH_BPF, &bpf_prog_fd, sizeof(bpf_prog_fd)) to attach the program to the listening socket. 6. Accepting connections (accept). The eBPF program would then execute for each incoming data packet on the accepted client sockets (or the listen socket if configured for specific events). 7. Setting up a perf_buffer to read events from the http_events map.
This setup allows an application (or a proxy/agent wrapping it) to gain deep visibility into the TCP traffic it processes. The extracted data, like payload prefixes, can then be used for application-level protocol identification, custom logging, or to feed into advanced analytics tools. When aggregated across an open platform of microservices, these insights from socket filters can become a powerful source of information for an API gateway to enforce policies, monitor performance, and manage the overall API landscape, ensuring robust API delivery.
Advanced Techniques and Considerations
Working with eBPF for deep TCP packet inspection, while powerful, involves several advanced techniques and important considerations to ensure programs are robust, efficient, and secure.
Context Limitations and bpf_probe_read_kernel
eBPF programs run in a highly restricted environment. They cannot directly dereference arbitrary kernel pointers. Instead, they must use specific helper functions to safely read data from kernel memory.
bpf_probe_read_kernel(void *dst, u32 size, const void *src): This is the primary helper for reading arbitrary kernel memory. It safely attempts to readsizebytes fromsrc(a kernel pointer) intodst(a stack or map variable within the eBPF program). It performs bounds checks and handles potential page faults, returning 0 on success and a negative error code on failure (e.g., trying to read from invalid memory).BPF_CORE_READ/BPF_CORE_READ_FULL/BPF_CORE_READ_STR: Introduced withlibbpfand CO-RE (Compile Once – Run Everywhere), these macros are an evolution of safe kernel memory access. They are built on top ofbpf_probe_read_kernelbut add compile-time offset and size calculations for kernel structures, making eBPF programs much more resilient to kernel version changes. Instead of manually calculatingskb->head + skb->network_header, you useBPF_CORE_READ(skb, head) + BPF_CORE_READ(skb, network_header). This significantly improves portability and reduces development complexity.
When dealing with nested kernel structures (e.g., accessing fields within struct tcp_sock which is part of struct sock), BPF_CORE_READ is indispensable. Always prefer CO-RE enabled approaches with libbpf for production-grade eBPF development.
Performance Overhead
While eBPF is renowned for its efficiency, even well-written eBPF programs introduce some overhead. The key is to minimize this impact:
- Placement of Probes: Attaching
kprobes to extremely high-frequency functions (e.g., every instruction of a tight loop) can saturate CPU cycles. Choose strategic hook points that provide the necessary data with minimal execution. - Program Complexity: The verifier limits program size and instruction count. More complex programs (more instructions, more map lookups, more memory reads) will naturally consume more CPU time. Keep eBPF programs as lean and focused as possible.
- Data Copying: Minimize data copying from kernel space to user space (e.g., using
perf_event_array). Only send the absolutely necessary data. Aggregation within eBPF maps is often more efficient than sending every single event. - JIT Compilation: Ensure the kernel's eBPF JIT compiler is enabled (
CONFIG_BPF_JIT=y) for maximum performance. - Conditional Logic: Use conditional checks (
if) to exit early if an event is not of interest. For example, if you only care about SYN packets, immediately return if the SYN flag is not set.
Measure the performance impact of your eBPF programs, especially in production environments, using tools like perf to ensure they don't become a bottleneck.
Security Implications (Root Privileges, Careful Program Design)
eBPF programs operate in the kernel and have the potential to access sensitive data or even cause system instability if misused.
- Root Privileges: Loading eBPF programs typically requires root privileges (specifically, the
CAP_BPFandCAP_SYS_ADMINcapabilities). This means that any user or process with these capabilities could potentially load a malicious eBPF program. - Verifier as a Guard: The eBPF verifier is the primary security mechanism. It prevents programs from crashing the kernel, executing infinite loops, or accessing memory outside their allocated context. However, a carefully crafted program could still exfiltrate sensitive data if it has legitimate access to that data within its execution context and a way to send it to user space (e.g., via maps or perf events).
- Information Leakage: Ensure your eBPF programs do not unintentionally expose sensitive information to user space. Filter and anonymize data where necessary.
- Side Channels: Advanced attackers might try to use eBPF programs to create side channels or bypass security mechanisms. While rare, it's a theoretical concern.
- Least Privilege: Follow the principle of least privilege. Only grant necessary capabilities and restrict who can load eBPF programs.
Careful and responsible program design, coupled with robust security practices on the host system, are crucial.
Using eBPF Maps for Stateful Tracking
eBPF programs are stateless by default; each execution is independent. However, they can achieve statefulness by interacting with eBPF maps. Maps are kernel-resident data structures that eBPF programs can read from and write to. They are critical for:
- Aggregation: Counting events (e.g., number of SYN packets per minute, total bytes received per connection).
- State Tracking: Storing per-connection metrics (e.g., tracking the RTT for a TCP flow).
- Configuration: User space can write configuration parameters to maps, which eBPF programs then read to modify their behavior dynamically.
- Communication: Sharing data between different eBPF programs or between eBPF programs and user space.
Common map types include: * BPF_MAP_TYPE_HASH: General-purpose hash tables. * BPF_MAP_TYPE_ARRAY: Fixed-size arrays, very efficient for simple counters. * BPF_MAP_TYPE_PERF_EVENT_ARRAY: For sending event streams to user space. * BPF_MAP_TYPE_RINGBUF: A high-performance, single-producer, single-consumer ring buffer for event streams, often preferred over perf_event_array for lower latency.
For example, to track the number of incoming TCP connections from each source IP, you'd use a BPF_MAP_TYPE_HASH with the source IP as the key and a counter as the value.
Interacting with User-space (BCC, libbpf)
The real power of eBPF often comes from its integration with user-space applications. These applications are responsible for:
- Program Loading: Compiling (or loading pre-compiled) eBPF programs and loading them into the kernel.
- Map Management: Creating, updating, and reading data from eBPF maps.
- Event Processing: Reading events streamed from
perf_event_arrayorringbufmaps, then processing, aggregating, and presenting the data. - BCC (BPF Compiler Collection): Excellent for rapid prototyping and interactive tools. It provides a Python front-end that dynamically compiles C eBPF code. It simplifies attaching probes, managing maps, and reading events. However, it carries a runtime dependency on Clang/LLVM.
libbpf: The modern, lower-level C library for eBPF. It's used to build self-contained eBPF applications (often called "BPF CO-RE applications") that typically ship with pre-compiled eBPF bytecode. It has no runtime compiler dependency on the target system and offers better performance and stability for production. Rust bindings (libbpf-rs) also exist.
Choose BCC for quick exploration and libbpf for robust, deployable solutions.
Kernel Version Compatibility
eBPF is a rapidly evolving technology. Kernel features, helper functions, and structure offsets can change between kernel versions.
- CO-RE (Compile Once – Run Everywhere): This
libbpffeature (enabled byBPF_CORE_READmacros) uses BPF Type Format (BTF) information embedded in the kernel and eBPF object files to automatically adjust structure offsets at load time. This allows a single eBPF binary to run across different kernel versions, significantly improving portability. Always aim for CO-RE compatibility. - Specific Kernel Features: Newer kernel versions introduce new eBPF program types, helper functions, and map types. If your program relies on a very new feature, it will only run on kernels that support it.
- Testing: Thoroughly test your eBPF programs across the range of kernel versions you intend to support.
By mastering these advanced techniques and keeping these considerations in mind, you can develop sophisticated, robust, and performant eBPF solutions for inspecting incoming TCP packets, unlocking deep insights into your network and application behavior.
Use Cases and Practical Applications
The ability to inspect incoming TCP packets with eBPF opens up a vast array of practical applications across network troubleshooting, security monitoring, performance optimization, and even application-level insights. The granular, low-overhead visibility provided by eBPF allows for solutions that were previously difficult, if not impossible, to achieve with traditional tools.
Network Troubleshooting
eBPF is a powerful diagnostic tool for unraveling complex network issues. * Latency Analysis: By attaching kprobes to kernel functions involved in packet reception and socket processing (e.g., tcp_v4_rcv, tcp_rcv_established), you can precisely timestamp packet arrivals and delivery to the application. Aggregating these timestamps in eBPF maps can reveal where delays are accumulating in the network stack, identifying whether latency is due to the network itself, kernel processing, or application scheduling. * Retransmissions and Packet Loss: Probing functions like tcp_retransmit_skb or observing specific TCP sequence/acknowledgment numbers in incoming packets can directly identify when and why segments are being retransmitted. XDP programs can detect and count dropped packets at the earliest stage due to network interface saturation. This helps pinpoint whether packet loss is occurring on the wire, at the NIC, or deeper within the kernel. * Connection Issues: Use kprobes on tcp_v4_rcv to observe SYN packets and inet_csk_accept to track accepted connections. Combine this with sock_ops events to monitor the full TCP handshake lifecycle. This can help diagnose problems with connection establishment (e.g., SYN packets arriving but no corresponding ACK, or connections getting stuck in SYN_RECV state), server overload, or firewall issues.
Security Monitoring
eBPF provides unparalleled capabilities for real-time threat detection and security auditing. * Anomaly Detection: Baseline normal TCP traffic patterns (e.g., connection rates, packet sizes, flag distributions). eBPF can then detect deviations, such as sudden spikes in SYN packets (potential SYN flood), an unusual number of RST packets (potential port scanning or forceful connection termination), or unexpected traffic on specific ports. * Intrusion Detection: XDP programs can implement high-performance, early-stage filtering of known malicious IP addresses or patterns, effectively acting as an in-kernel firewall. kprobes can detect suspicious activities like unauthorized connections to sensitive ports or unusual data flows. For instance, detecting unexpected PSH flags with data on control-plane API ports could signal an attempted exploit. * Unencrypted Traffic Detection: If a policy dictates that all sensitive traffic must be encrypted (e.g., TLS), eBPF can inspect the initial bytes of application-layer payload (especially with socket filters) to look for known unencrypted protocol signatures on ports typically used for encrypted communication, alerting to potential security violations. * Port Scanning Detection: Counting unique destination port attempts from a single source IP over a short period using eBPF maps can quickly identify port scanning activities.
Performance Optimization
Beyond troubleshooting, eBPF is a potent tool for proactively optimizing network and application performance. * Identifying Bottlenecks: By correlating network events with application behavior (e.g., using kprobes on both network functions and application system calls like read/write), you can determine if the network or the application itself is the primary bottleneck for incoming data processing. * Buffer Bloat Detection: Monitor socket buffer usage (e.g., sk_rmem_alloc in struct sock) as incoming packets arrive. High and sustained buffer usage can indicate buffer bloat, leading to increased latency. * Application-Specific Performance Metrics: For applications serving numerous API requests, socket filters can be used to extract the size of incoming HTTP requests or the time taken to process the initial part of a request before it's handed to user space. This granular data can inform application-specific tuning. * Connection Optimization: Use sock_ops to dynamically adjust TCP window sizes or other parameters based on observed network conditions, optimizing throughput for specific workloads.
Application-Level Insights and API Management
While eBPF operates at a low level, the insights it provides are invaluable for higher-level application and API management, especially in distributed systems. * Protocol Parsing: For simple protocols (e.g., HTTP/1.x headers, basic RPC handshakes), an eBPF socket filter can parse the initial bytes of the incoming payload to identify the protocol, method, or even the target API endpoint. This data can be aggregated to understand application traffic patterns. * Request/Response Tracking: By correlating incoming requests (identified by initial payload inspection) with outgoing responses (via similar eBPF programs on egress), one can build a low-overhead, in-kernel system for tracking request-response latency at the kernel boundary. * Microservices Observability: In a microservices architecture, eBPF can provide per-service network metrics. For instance, an eBPF program can identify which microservice is receiving the most inbound connections, which is experiencing the highest network latency, or which is generating unexpected traffic patterns. This holistic view is crucial for managing complex deployments.
It's at this intersection of deep network insight and application-level behavior that platforms like APIPark become critically relevant. While eBPF provides unparalleled low-level network visibility to diagnose issues like high latency or dropped packets, the insights gained are often crucial for maintaining the health and performance of distributed systems and microservices. In such architectures, managing the interactions between services via APIPark, an open platform AI gateway and API management platform, becomes paramount for ensuring robust API delivery, security, and operational efficiency. eBPF provides the foundational telemetry, while APIPark offers the structured management and governance for the diverse set of APIs built upon these network foundations. The combination allows for a truly comprehensive observability and management solution, from the raw packets to the exposed services.
The Future of eBPF in Network Observability
The eBPF ecosystem is one of the most vibrant and rapidly expanding areas in Linux kernel development. Its capabilities for network observability are constantly being extended, promising even more powerful tools and techniques in the future. * Cloud-Native Integration: eBPF is becoming a cornerstone for cloud-native networking, security, and observability tools. Projects like Cilium leverage eBPF for high-performance networking, security policies, and transparent observability in Kubernetes. * Hardware Offloading: Continued development in XDP offloading allows eBPF programs to execute directly on the NIC, pushing performance to the absolute limits and freeing up host CPU resources. * Emerging Standards and Tooling: The maturity of libbpf and the CO-RE approach is making eBPF development more accessible and portable. New tools and frameworks are continuously being developed to simplify complex eBPF tasks. * Runtime Verification and Enforcement: Beyond observability, eBPF is increasingly used for active enforcement of network policies, traffic shaping, and even implementing custom network protocols directly in the kernel.
The journey into eBPF for inspecting incoming TCP packets is one that promises deep technical understanding and practical benefits for anyone involved in building, operating, or securing networked systems. It represents a significant leap forward in our ability to interact with and understand the heart of the Linux kernel's networking capabilities.
Conclusion
The ability to peer deep into the flow of incoming TCP packets is not merely an academic pursuit; it is a critical skill set in today's complex, interconnected computing landscape. From diagnosing elusive performance bottlenecks and shoring up network security defenses to optimizing application delivery and gaining granular insights into distributed systems, understanding every byte of an incoming TCP segment is paramount. For decades, achieving this level of insight without incurring significant overhead or risking system instability remained a daunting challenge, often relegated to specialized and intrusive kernel modifications.
eBPF has fundamentally changed this equation. By providing a safe, efficient, and highly programmable in-kernel virtual machine, eBPF empowers developers and system administrators to dynamically instrument the Linux kernel, observing network events with unprecedented precision. We've explored the foundational concepts of TCP/IP, the revolutionary architecture of eBPF, and the practicalities of setting up an eBPF development environment. More importantly, we've delved into the diverse array of eBPF program types—from the low-latency, early-stage filtering power of XDP to the surgical precision of kprobes for deep kernel function tracing, and the application-centric focus of socket filters. Each type offers a unique lens through which to observe incoming TCP packets, enabling targeted analysis tailored to specific needs.
We've also touched upon advanced considerations such as safe kernel memory access with BPF_CORE_READ, managing performance overhead, understanding security implications, leveraging eBPF maps for stateful tracking, and navigating kernel version compatibility with CO-RE. These aspects are vital for building robust, production-ready eBPF solutions. The practical applications span a wide spectrum, from pinpointing network latency and detecting security anomalies to optimizing application throughput and gaining nuanced insights into API traffic flows within microservices architectures. Indeed, the foundational telemetry provided by eBPF forms a crucial layer beneath higher-level platforms like APIPark, which then take these insights to manage, secure, and optimize the overall API management lifecycle.
The eBPF ecosystem is a vibrant and continually evolving open platform, pushing the boundaries of what's possible in kernel-level observability and programmability. Embracing eBPF for inspecting incoming TCP packets is not just adopting a new tool; it's a strategic investment in deeper understanding, greater control, and superior performance for any networked system. The journey into eBPF is a rewarding one, unlocking an unparalleled vantage point from which to observe and master the intricate world of network communication.
Frequently Asked Questions (FAQs)
1. What is the primary advantage of using eBPF for TCP packet inspection over traditional tools like tcpdump? The primary advantage is eBPF's ability to execute custom programs directly within the Linux kernel in a safe and efficient manner. Unlike tcpdump, which operates in user space and incurs overhead by copying packets across the kernel-user space boundary, eBPF programs run in kernel space, often JIT-compiled to native machine code. This minimizes overhead, allows for real-time processing and filtering at various strategic hook points (including the earliest receive path via XDP), and provides access to rich kernel context (like socket state) that tcpdump cannot easily expose.
2. Which eBPF program type is best for detecting a SYN flood attack on a server? For detecting and mitigating a SYN flood attack, XDP (eXpress Data Path) programs are generally the most effective. XDP programs execute at the very earliest stage of packet reception, directly on the network interface card's driver. This allows them to inspect incoming packets, identify SYN packets, and XDP_DROP malicious traffic with minimal CPU overhead, before the packets even enter the main kernel network stack, thus preventing saturation of kernel resources and the TCP stack.
3. Can eBPF programs inspect the application-level payload of an incoming TCP packet? Yes, eBPF programs can inspect the application-level payload of an incoming TCP packet. However, this must be done with caution. socket filters (SO_ATTACH_BPF) are particularly well-suited for this, as they operate on packets destined for a specific application's socket, where the payload is directly available in the sk_buff structure. For general system-wide inspection, kprobes on functions like tcp_v4_rcv can also access the payload. When reading payload data, it's crucial to perform strict bounds checking using helpers like bpf_probe_read_kernel and to be mindful of performance overhead and potential security implications of exposing sensitive data.
4. How does eBPF ensure safety and prevent kernel crashes when running user-defined programs? eBPF ensures safety through a crucial component called the eBPF Verifier. Before any eBPF program is loaded into the kernel, the verifier statically analyzes its bytecode. It checks for properties like guaranteed termination (no infinite loops), memory safety (no out-of-bounds access or arbitrary kernel memory dereferencing), and proper use of helper functions. If the program fails any of these checks, it is rejected, preventing it from crashing the kernel or compromising system integrity. Additionally, eBPF programs run in a sandboxed environment with limited access to kernel resources.
5. How can eBPF insights be used in conjunction with API management platforms? eBPF provides deep, low-level network and kernel observability, offering granular data on connection health, packet flow, latency, and even rudimentary application protocol parsing. These insights are invaluable for diagnosing the root causes of performance degradation or security incidents affecting APIs. An API management platform, such as APIPark, operates at a higher layer, focusing on the lifecycle, security, and performance of the APIs themselves. By integrating eBPF-derived telemetry (e.g., from socket filters monitoring API service traffic) into an API management system, organizations can gain a holistic view: eBPF provides the "why" behind network-related API issues, while the API platform manages the "what" and "how" of API delivery, enforcement, and optimization. This combination enables more intelligent traffic routing, advanced threat detection, and proactive performance tuning for APIs.
🚀You can securely and efficiently call the OpenAI API on APIPark in just two steps:
Step 1: Deploy the APIPark AI gateway in 5 minutes.
APIPark is developed based on Golang, offering strong product performance and low development and maintenance costs. You can deploy APIPark with a single command line.
curl -sSO https://download.apipark.com/install/quick-start.sh; bash quick-start.sh

In my experience, you can see the successful deployment interface within 5 to 10 minutes. Then, you can log in to APIPark using your account.

Step 2: Call the OpenAI API.